
Figure 3
- ID
- ZDB-FIG-200125-30
- Publication
- Arora et al., 2020 - Stepwise polarisation of developing bilayered epidermis is mediated by aPKC and E-cadherin in zebrafish
- Other Figures
-
- Figure 1
- Figure 1—figure supplement 1.
- Figure 1—figure supplement 2.
- Figure 1—figure supplement 3.
- Figure 1—figure supplement 4—source data 2.
- Figure 2
- Figure 2—figure supplement 1.
- Figure 2—figure supplement 2.
- Figure 2—figure supplement 3—source data 4.
- Figure 2—figure supplement 4—source data 2.
- Figure 3
- Figure 4
- Figure 4—figure supplement 1.
- Figure 4—figure supplement 2—source data 9.
- Figure 4—figure supplement 3.
- Figure 5
- Figure 5—figure supplement 1.
- Figure 5—figure supplement 2.
- Figure 5—figure supplement 3.
- Figure 5—figure supplement 4.
- All Figure Page
- Back to All Figure Page
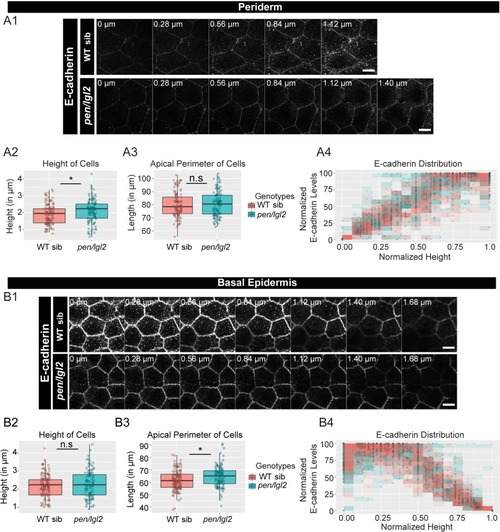
The loss of pen/lgl2 function has no effect on E-cadherin polarity. Immunolocalisation of E-cadherin at various cell heights (0 µm is apical) along the apicobasal axis in wild-type sibling (WT sib) and pen/lgl2 mutant in the periderm (A1) and basal epidermis (B1) at 72hpf. Comparison between WT siblings and pen/lgl2 mutants in the periderm (A2–A4) and the basal epidermis (B2–B4) for height of cells (A2, B2) and apical perimeter (A3, B3). Graphs showing polarised distribution of E-cadherin across normalised cell height in the periderm (A4) and basal epidermis (B4) in WT siblings and pen/lgl2 mutants. Scale bar corresponds to 10 µm in A1 and B1. AU = Arbitrary Units; WT = wild type and sib = sibling/s. Asterisk indicates significant difference (p<0.05) and n.s. means non-significant difference by Mann Whitney U statistical test. Source file with fluorescence intensities for periderm and basal epidermis is available as Figure 3—source data 1 and 2, respectively. Statistical analysis with p values for all the graphs of periderm and basal epidermis is available as Figure 3—source data 3 and 4, respectively. |