Figure 4
- ID
- ZDB-FIG-191230-408
- Publication
- Wong et al., 2019 - Synaptic mitochondria regulate hair-cell synapse size and function
- Other Figures
- All Figure Page
- Back to All Figure Page
|
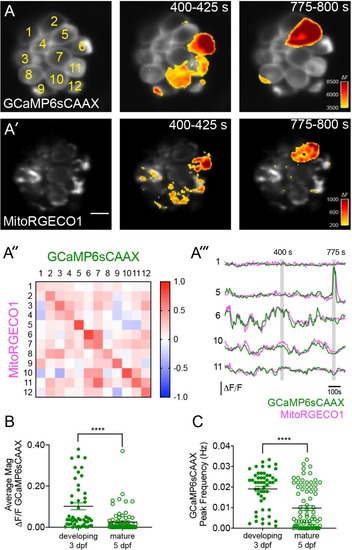
Spontaneous presynaptic- Ca2+ influx and mito-Ca2+ uptake are linked.(A-A’) A live Image of an immature neuromast viewed top-down, expressing the presynaptic-Ca2+sensor GCaMP6sCAAX (A) and mito-Ca2+ sensor MitoRGECO1 (A’) at 3 dpf. Example GCaMP6sCAAX (A’) and MitoRGECO1 (A’) signals during two 25 s windows within a 900 s acquisition are indicated by the ?F heatmaps and occur in the same cells. (A’’) A heatmap of Pearson correlation coefficients comparing GCaMP6sCAAX and MitoRGECO1 signals from the cells in A-A’. (A’’’) Example GCaMP6sCAAX (green) MitoRGECO1 (magenta) traces during the 900 s acquisition from the 5 cells numbered in A, also see Video 2. (B) Scatter plot showing the average magnitude of GCaMP6sCAAX signals in developing and mature hair cells, n = 6 neuromasts per age. (C) Scatter plot showing frequency of GCaMP6sCAAX events in developing and mature hair cells, n = 6 neuromasts. Error bars in B-C represent SEM. A Mann-Whitney U test was used in B and C. ****p<0.0001. Scale bar = 5 µm in A’. |

