
- Title
-
Synaptic mitochondria regulate hair-cell synapse size and function
- Authors
- Wong, H.C., Zhang, Q., Beirl, A.J., Petralia, R.S., Wang, Y.X., Kindt, K.
- Source
- Full text @ Elife
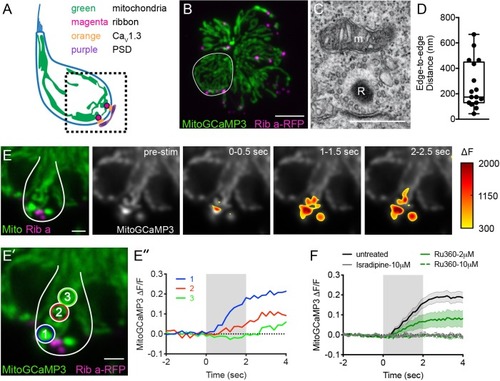
Mito-Ca2+ uptake initiates adjacent to ribbons.(A) Cartoon illustration of a lateral-line hair cell containing: an apical mechanosensory bundle (blue), mitochondria (green), presynaptic ribbons (magenta), CaV1.3 channels (orange) and postsynaptic densities (purple). (B) Airyscan confocal image of 6 live hair cells (1 cell outlined in white) expressing MitoGCaMP3 (mitochondria) and Ribeye a-tagRFP (ribbons) in a developing neuromast at 2 dpf. Also see Figure 1—figure supplement 1. (C) A representative TEM showing a mitochondrion (m) in close proximity to a ribbon (R) at 4 dpf. (D) Quantification of mitochondrion to ribbon distance in TEM sections (n = 17 ribbons). (E) Side-view of a hair cell (outlined in white) shows the spatio-temporal dynamics of evoked mito-Ca2+ signals during a 2 s stimulation at 6 dpf. The change in MitoGCaMP3 signal (?F) from baseline is indicated by the heatmap and are overlaid onto the pre-stimulus grayscale image. (E’-E’’) Circles 1–3 (1.3 μm diameter) denote regions used to generate the normalized (?F/F0) temporal traces of mito-Ca2+ signals in E’’: adjacent to the presynapse (‘1’), and midbody (‘2’ and ‘3’) in the same cell as E. (F) Average evoked mito-Ca2+ response before (solid black) and after 30 min treatment with 10 μM Ru360 (dashed green), 2 μM Ru360 (solid green), or 10 μM isradipine (gray) (3–5 dpf, n ≥ 9 cells per treatment). Error bars in D are min and max; in F the shaded area denotes SEM. Scale bar = 500 nm in C, 5 µm in B and 2 µm in E and E’. |
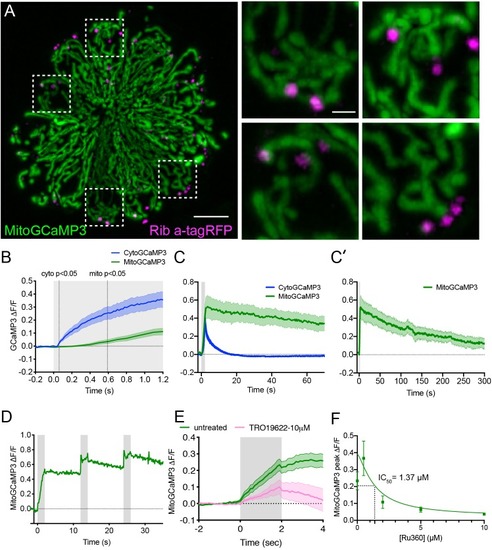
The time course of mechanically-evoked mito-Ca2+ signals are longer-lasting than cyto-Ca2+signals.(A) Airyscan confocal image of a live neuromast expressing MitoGCaMP3 (mitochondria) and Ribeye a-tagRFP (ribbons) at 6 dpf. Insets show the base of 4 individual hair cells from the neuromast in A (dashed white boxes). (B) Average cyto-Ca2+ (blue) and mito-Ca2+ (green) ?F/F GCaMP3 signals during the onset of a 2 s stimulus. Mito-Ca2+ signals rise with a delay compared to cyto-Ca2+ signals, 3–6 dpf, n ≥ 18 cells. (C-C’) Average cyto-Ca2+ and mito-Ca2+ ?F/F GCaMP3 signals during and after a 2 s stimulation shows that cyto-Ca2+ signals return to baseline shortly after stimulation (C) while mito-Ca2+ remains elevated up to 5 min after stimulation (C–C’), 3–6 dpf, n ≥ 7 cells. (D) A series of 3, evoked 2 s stimuli initiated at: t = 0–2, 12–14 and 24–26 s. A rise in MitoGCaMP3 can be detected during each stimulus, prior to MitoGCaMP3 signals returning to baseline. (E) 10 µM of the VDAC inhibitor TRO 19622 partially blocks evoked MitoGCaMP3 signals, 5 dpf, n = 15 cells. (F) A dose response curve indicates that Ru360 blocks evoked MitoGCaMP3 signals with an IC50 value of 1.37 µM at 5 dpf, n ≥ 9 cells per dose. Error in panel (B-C’) E and F represent SEM. Scale bar = 5 µm in A and 2 µm in inset. |
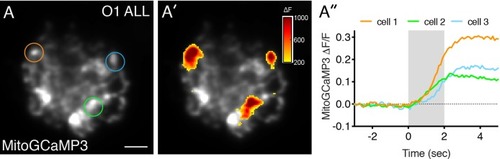
Mito-Ca2+ uptake occurs in anterior lateral-line hair cells.(A) A live Image of an anterior-lateral line (ALL) neuromast viewed top-down, expressing the mito-Ca2+ sensor MitoGCaMP3 at 5 dpf. (A’) shows the spatio-temporal dynamics of evoked mito-Ca2+ signals during a 2 s stimulation. The MitoGCaMP3 signals during the stimulation (?F) are indicated by the heatmap overlaid onto the baseline grayscale image. (A’’) Temporal traces of evoked mito-Ca2+ signals were generated from three regions denoted by three circles in A. Scale bar = 5 µm in A. |
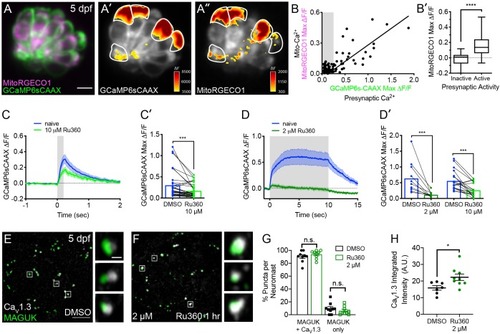
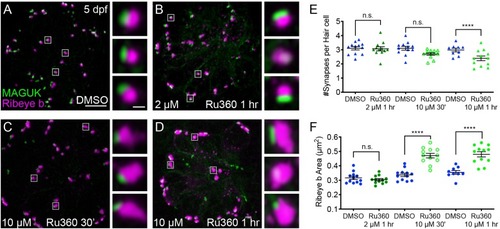
Mito-Ca2+ uptake can impact presynaptic-Ca2+ signals.(A) A live Image of a neuromast viewed top-down, expressing the presynaptic-Ca2+ sensor GCaMP6sCAAX (green) and mito-Ca2+ sensor MitoRGECO1 (magenta) at 5 dpf. A’-A’’, GCaMP6sCAAX (A’) and MitoRGECO1 (A’’) signals (?F) from baseline during a 2 s stimulation are indicated by the heatmaps and occur in the same cells (white outline). (B) Scatter plot with linear regression of peak presynaptic- and mito-Ca2+ response for individual cells at 4–5 dpf, n = 136 cells. Gray background in graph denotes presynaptic-Ca2+ signals below 0.25, a threshold used as a cutoff for presynaptic activity (below inactive, above active). (B’) Plot of mito-Ca2+responses segregated based on the activity threshold in B. (C-D’) Presynaptic-Ca2+ response (example in Figure 2—figure supplement 1C–C’) averaged per cell before (blue) and after a 30 min treatment with 10 μM Ru360 (light green) or 2 μM Ru360 (dark green), n ≥ 10 cells per treatment. C and D show averaged traces while C’ and D’ show before-and-after dot plots of the peak response per cell. (E-F) Representative images of mature neuromasts (5 dpf) immunostained with CaV1.3 (white, calcium channels) and MAGUK (green, postsynapses) after a 1 hr incubation in 0.1% DMSO (E) or 2 μM Ru360 (F). G-H, Scatter plots show percentage of postsynapses that pair with CaV1.3-channel clusters (CaV1.3 + MAGUK) and orphan postsynapses (MAGUK only) (G). The integrated intensity of CaV1.3-channel immunolabel at presynapses is lower in control compared to treatment group (H), n ≥ 7 neuromasts per treatment. Whiskers on plots in B’ represent min and max; the shaded area in plots C and D and the error bars in C’, D’ and G-H denotes SEM. Mann-Whitney U test was used in B’; Wilcoxon matched-pairs signed-rank test was used in C’ and D’. Welch’s unequal variance t-test was used in G-H. *p<0.05, ***p<0.001, ****p<0.0001. Scale bar = 5 µm in A and E. |
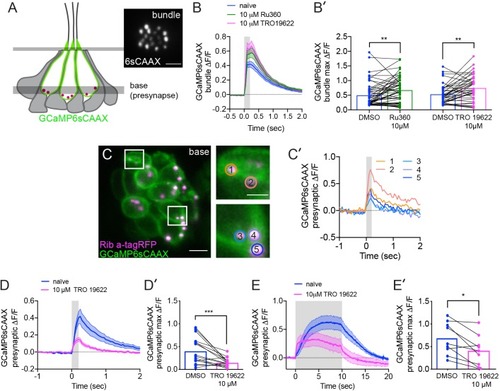
The effects of MCU and VDAC block on mechanotransduction and the effect of VDAC block on presynaptic-Ca2+ signals.(A) Illustration of a neuromast and the imaging planes used to study the mechanotransduction in hair-bundles and the presynaptic-Ca2+ influx at ribbons. Localization of the membrane-localized Ca2+ sensor GCaMP6sCAAX shown in green. Inset in A shows an example top-down view of GCaMP6sCAAX bundle plane (6sCAAX) at 5 dpf. (B-B’) Bundle-Ca2+ signals before (blue) and after a 30 min treatment with 10 μM Ru360 (green) or 10 μM TRO 19622 (magenta), n ≥ 39 bundles per treatment. Average traces are shown in B while dot plots of the peak response per bundle are shown in B’. (C) Double-transgenic hair cells expressing GCaMP6sCAAX (At presynaptic membranes) and Ribeye a-tagRFP (Labels ribbons) at 5 dpf. Example cells in presynaptic imaging plane are boxed in white and duplicated in right insets. (C’) Example cells show evoked presynaptic-Ca2+ signals at ribbons during a 0.2 s stimulation. Circles 1–5 (1.3 μm diameter) in insets in C denote regions at ribbons used to generate the temporal traces of presynaptic-Ca2+ signals at each ribbon in C’. Similarly-colored traces of presynaptic-Ca2+ signals originate from different presynapses of the same cell. (D-E’) Presynaptic-Ca2+ signals averaged per cell before (blue) and after a 30 min 10 μM TRO 19622 (magenta), n ≥ 9 cells per treatment. D and E show averaged traces while D’ and E’ show before-and-after treatment dot plots of the peak response per cell. Error in panel B-B’, D-E’ represent SEM. A Wilcoxon matched-pairs signed-rank test was used in B’,D’ and E’. *p<0.05, **p<0.01, ***p<0.001. Scale bar = 5 µm in A and C and 2 µm in C inset. |
Mito-Ca2+ is important for ribbon size and synapse integrity in mature hair cells.(A-D) Representative images of mature neuromasts (5 dpf) immunostained with Ribeye b (magenta, ribbons) and MAGUK (green, postsynapses) after a 1 hr 0.1% DMSO (A), a 1 hr 2 μM Ru360 (B), a 30 min 10 μM Ru360 (C), or a 1 hr 10 μM Ru360 (D) treatment. Insets show three example synapses (white squares). E-F, Scatter plots show synapse counts (E), and ribbon area (F) in controls and in treatment groups. Ribbon areas, synapse numbers, and hair-cell counts are unaffected after a 1 hr 2 µM Ru360 treatment. Ribbon areas are larger and there are fewer synapses without significant loss of hair cells after a 30 min treatment with 10 µM Ru360 (F). After a 1 hr 10 µM Ru360 treatment there is an increase in ribbon area and a decrease in synapse (E) and hair-cell counts. N ≥ 9 neuromasts per treatment. Error bars in E-F represent SEM. An unpaired t-test was used in E and a Welch’s unequal variance t-test was used in F. ****p<0.0001. Scale bar = 5 µm in A, and 2 µm in inset. |
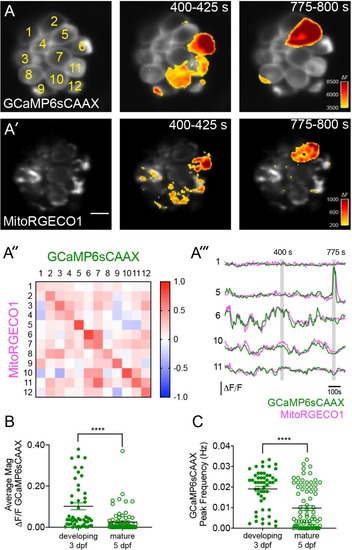
Spontaneous presynaptic- Ca2+ influx and mito-Ca2+ uptake are linked.(A-A’) A live Image of an immature neuromast viewed top-down, expressing the presynaptic-Ca2+sensor GCaMP6sCAAX (A) and mito-Ca2+ sensor MitoRGECO1 (A’) at 3 dpf. Example GCaMP6sCAAX (A’) and MitoRGECO1 (A’) signals during two 25 s windows within a 900 s acquisition are indicated by the ?F heatmaps and occur in the same cells. (A’’) A heatmap of Pearson correlation coefficients comparing GCaMP6sCAAX and MitoRGECO1 signals from the cells in A-A’. (A’’’) Example GCaMP6sCAAX (green) MitoRGECO1 (magenta) traces during the 900 s acquisition from the 5 cells numbered in A, also see Video 2. (B) Scatter plot showing the average magnitude of GCaMP6sCAAX signals in developing and mature hair cells, n = 6 neuromasts per age. (C) Scatter plot showing frequency of GCaMP6sCAAX events in developing and mature hair cells, n = 6 neuromasts. Error bars in B-C represent SEM. A Mann-Whitney U test was used in B and C. ****p<0.0001. Scale bar = 5 µm in A’. |
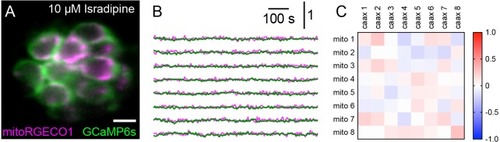
Spontaneous presynaptic and mito-Ca2+ signals are abolished by CaV1.3 channel antagonist isradipine.(A) A live Image of a neuromast viewed top-down, expressing the presynaptic-Ca2+ sensor GCaMP6sCAAX (green) and mito-Ca2+ sensor MitoRGECO1 (magenta) at 6 dpf. (B) Representative GCaMP6sCAAX (green) and MitoRGECO1 (magenta) traces from the cells in A during a 900 s continuous image acquisition in the absence of stimuli and 10 µM isradipine. (C) There is no correlation between GCaMP6sCAAX and MitoRGECO1 signals within each cell from B in the presence of isradipine. Scale bar = 5 µm in A |
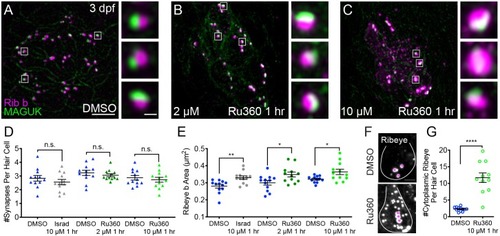
Mito-Ca2+ regulates ribbon formation.(A-C) Representative images of immature neuromasts (3 dpf) immunostained with Ribeye b (magenta, ribbons) and MAGUK (green, postsynapses) after a 1 hr 0.1% DMSO (A), 2 μM Ru360 (B) or 10 µM Ru360 (C) treatment. Insets show three representative synapses (white squares) for each treatment. D-E, Scatter plot show quantification of synapse number (D), and ribbon area (E) in controls and in treatment groups. (F) Side-view of 2 hair cells (white outline) shows synaptic ribbon (three magenta asterisks in each cell) and extrasynaptic Ribeye b aggregates after a 1 hr 0.1% DMSO or 10 μM Ru360 treatment. (G) Quantification of extrasynaptic Ribeye puncta. N ≥ 12 neuromasts per treatment. Error bars in D-E and G represent SEM. An unpaired t-test was used in D and a Welch’s unequal variance t-test was used in E and G, *p<0.05, **p<0.01, ****p<0.0001. Scale bar = 5 µm in A, 2 µm in insets and F. |
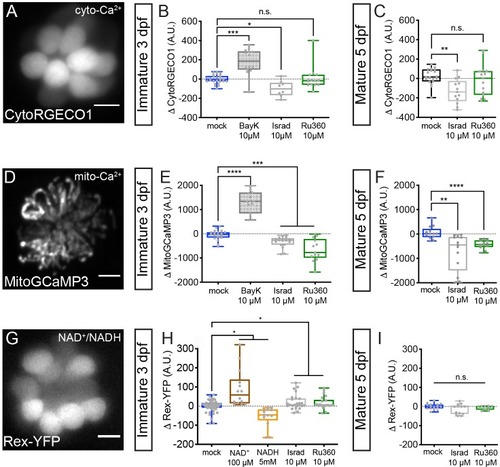
Cyto-Ca2+, mito-Ca2+ and NAD+/NADH redox baseline measurements.Live hair cells expressing RGECO1 (A), MitoGCaMP3 (D), or Rex-YFP (G) show resting cyto-Ca2+, mito-Ca2+ or NAD+/NADH levels respectively. (B-C) RGECO1 baseline measurements before and after a 30 min mock treatment (0.1% DMSO) or after a 30 min 10 μM Bay K8644 (BayK), 10 μM isradipine, or 10 μM Ru360 treatment. (E-F) MitoGCaMP3 baseline measurements before and after a 30 min mock treatment (0.1% DMSO) or after a 10 μM BayK, 10 μM isradipine, or 10 μM Ru360 treatment. (H-I) Rex-YFP baseline measurements before and after 30 min mock treatment (0.1% DMSO) or after a 30 min 100 μM NAD+, 5 mM NADH, 10 μM isradipine, or 10 μM Ru360 treatment. All plots are box-and-whiskers plot that show median, min and max. N ≥ 9 neuromasts per treatment. A one-way Brown-Forsythe ANOVA with Dunnett’s T3 post hoc was used to calculate the difference in (B-C), (E-F), and a one-way Brown-Forsythe and Welch ANOVA with Holm-Sidak’s post hoc was used in H-I, *p<0.05, **p<0.01, ***p<0.001, ****p<0.0001. Horizontal lines in E, H, and I indicate that both conditions had similar p values compared to mock treatment. Scale bar = 5 μm in A, D and G. |
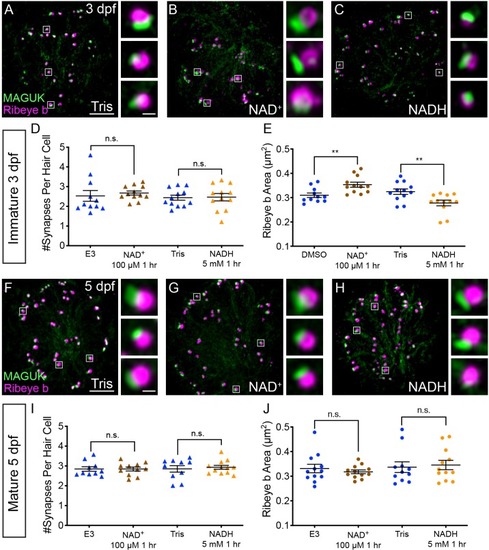
NAD+ and NADH directly influence ribbon formation.Representative images of immature (A-C, 3 dpf) and mature (G-H, 5 dpf) neuromasts immunostained with Ribeye b (magenta, ribbons) and MAGUK (green, postsynapses) after a 0.1% Tris-HCl (A, F), 100 μM NAD+ (B, G) or 5 mM NADH treatment (C, H). Insets show three example synapses (white squares). D-E and I-J, Scatter plots show synapse count (D, I) and ribbon area (E, J) in controls and treatments groups. N ≥ 10 neuromasts per treatment. Error bars in B-C represent SEM. An unpaired t-test was used for comparisons in D and I and a Welch’s unequal variance t-test was used for comparisons in E and J, **p<0.01. Scale bar = 5 µm in A and F, 2 µm in insets. |