
Figure 2-S1
- ID
- ZDB-FIG-191230-403
- Publication
- Wong et al., 2019 - Synaptic mitochondria regulate hair-cell synapse size and function
- Other Figures
- All Figure Page
- Back to All Figure Page
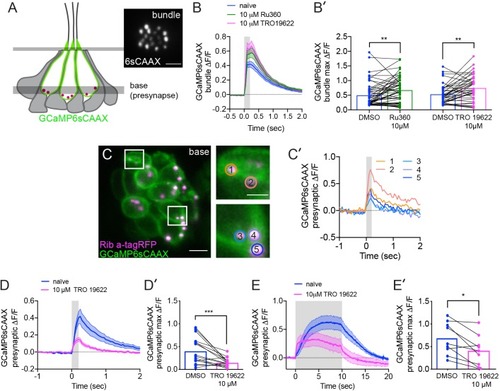
The effects of MCU and VDAC block on mechanotransduction and the effect of VDAC block on presynaptic-Ca2+ signals.(A) Illustration of a neuromast and the imaging planes used to study the mechanotransduction in hair-bundles and the presynaptic-Ca2+ influx at ribbons. Localization of the membrane-localized Ca2+ sensor GCaMP6sCAAX shown in green. Inset in A shows an example top-down view of GCaMP6sCAAX bundle plane (6sCAAX) at 5 dpf. (B-B’) Bundle-Ca2+ signals before (blue) and after a 30 min treatment with 10 μM Ru360 (green) or 10 μM TRO 19622 (magenta), n ≥ 39 bundles per treatment. Average traces are shown in B while dot plots of the peak response per bundle are shown in B’. (C) Double-transgenic hair cells expressing GCaMP6sCAAX (At presynaptic membranes) and Ribeye a-tagRFP (Labels ribbons) at 5 dpf. Example cells in presynaptic imaging plane are boxed in white and duplicated in right insets. (C’) Example cells show evoked presynaptic-Ca2+ signals at ribbons during a 0.2 s stimulation. Circles 1–5 (1.3 μm diameter) in insets in C denote regions at ribbons used to generate the temporal traces of presynaptic-Ca2+ signals at each ribbon in C’. Similarly-colored traces of presynaptic-Ca2+ signals originate from different presynapses of the same cell. (D-E’) Presynaptic-Ca2+ signals averaged per cell before (blue) and after a 30 min 10 μM TRO 19622 (magenta), n ≥ 9 cells per treatment. D and E show averaged traces while D’ and E’ show before-and-after treatment dot plots of the peak response per cell. Error in panel B-B’, D-E’ represent SEM. A Wilcoxon matched-pairs signed-rank test was used in B’,D’ and E’. *p<0.05, **p<0.01, ***p<0.001. Scale bar = 5 µm in A and C and 2 µm in C inset. |