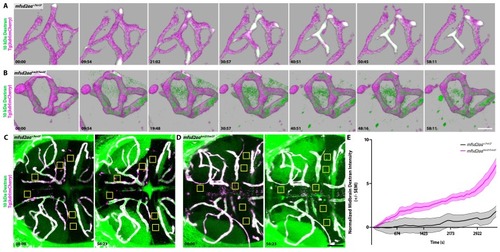
(A) Time course stills of Dextran tracer dynamics at 5 dpf in mfsd2aa heterozygote controls reveals a sealed BBB. (B) Time course stills of Dextran tracer dynamics in mfsd2aa mutants at 5 dpf reveals a leaky BBB, with increased overall Dextran extravasation into the brain parenchyma. The scale bar represents 20 µm. (C and D) Representative dorsal maximum intensity projection of the midbrain of mfsd2aa heterozygotes (C) and mfsd2aa mutants (D) at the first and last time point examined. While the heterozygotes restrict the Dextran within the cerebral blood vessels at 5 dpf, mfsd2aa mutants exhibit a large increase in overall parenchymal Dextran intensity over the course of 1 hr. Boxed regions are representative of the 6 areas per fish used for analysis in E. The scale bar represents 50 µm. (E) Quantification of Dextran intensity in the brain parenchyma over time in heterozygote controls (black) and mfsd2aa mutants (magenta) shows a significant difference in tracer leakage dynamics (p<0.0001, Mann Whitney U test), with both more total Dextran accumulation and a faster rate of Dextran accumulation in the mutant brain parenchyma than heterozygote controls. N = 9 fish with 6 regions analyzed and averaged per fish and normalized to Dextran intensity in circulation.
|
