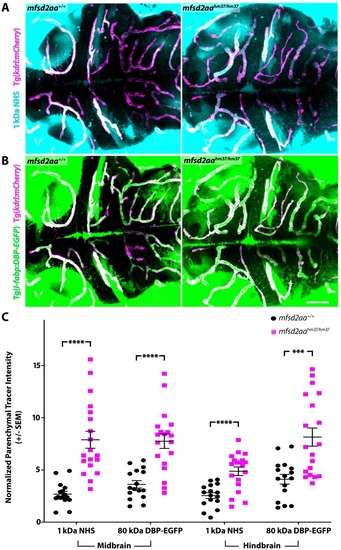
(A) Representative maximum intensity projection images of the brain of wild-type and mfsd2aa mutants injected with a fluorescent 1 kDa NHS tracer (turquoise) at 5 dpf. Mfsd2aa mutants have increased levels of NHS in the midbrain and hindbrain parenchyma outside of the vasculature (magenta; Tg(kdrl:mCherry)) compared to wild-type siblings. (B) Representative maximum intensity projection images of the brain of wild-type and mfsd2aa mutants expressing the fluorescently labeled 80 kDa transgenic serum protein DBP-EGFP (green) at 5 dpf. Mfsd2aa mutants have increased levels of DBP-EGFP in the midbrain and hindbrain parenchyma compared to wild-type siblings. The scale bar represents 50 �m. (C) Quantification of normalized parenchymal tracer intensity in the midbrain and hindbrain of wild-type (black) and mfsd2aa mutants (magenta) reveals that mfsd2aa mutants have significantly increased levels of tracer permeability, both for the injected NHS (A) and the endogenous transgene DBP-EGFP (B). Parenchymal tracer intensity outside of the vasculature was measured and normalized to the blood vessel tracer intensity for both the midbrain and hindbrain in each fish and displayed as a single point. The mean and the standard error are drawn as black lines. ****p<0.0001, ***p<0.001 by t test.
|
