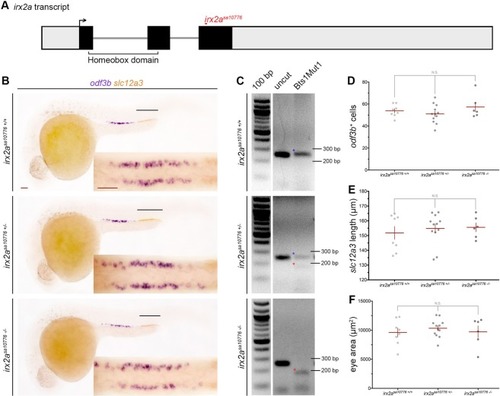
irx2a genetic mutants do not have a renal or eye phenotype. (A) Schematic of the irx2a transcript and location of the irx2asa10716 mutation, where grey is non-coding and black represents coding sequence. The forward arrow demarcates the ATG start site. (B) WISH analysis at the 28 ss shows odf3b and slc12a3 expression in irx2asa10716+/+, irx2asa10716+/−, and irx2asa10716−/− embryos. The black lines highlight the DL marker slc12a3. An enlarged dorsal view of the odf3b+ MCCs for each embryo is shown in the inset. Scale bars are 50 μm. (C) Gel image of the restriction digest product for each genotype. Wild-type bands are marked with a blue star, and mutant bands with a red star. (D) Quantification of odf3b+ cells at the 28 ss. Each dot represents one pronephros. (E) Quantification of the slc12a3 length (μm) at the 28 ss. Each dot represents one nephron. (F) Quantification of eye area (μm2). Each dot represents one eye. For all graphs, data is presented +/− SEM and statistical significance was determined by ANOVA. WISH – whole mount in situ hybridization, ss – somite stage, DL – distal late, MCC – multiciliated cell.
|
