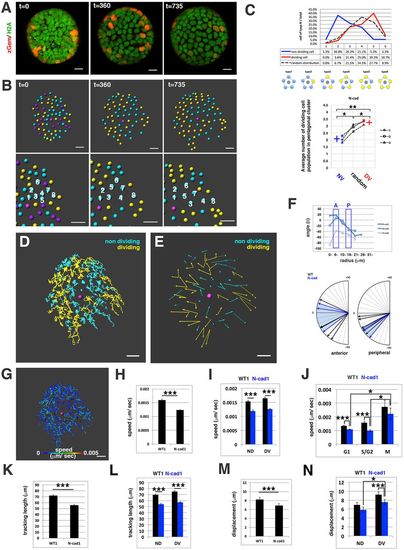
Cell movement in anterior lens epithelium of the N-cadherin morphant. (A) N-cadherin morphant lens epithelium combined with Tg(h2afva:GFP; EF1?:mCherry-zGem). This lens is designated as N-cad1. (B) (Upper) Schematics of images shown in A. Yellow, blue and purple indicate dividing, non-dividing and eliminated cell populations, respectively. (Lower) Enlarged view of upper panels. Numbers indicate individual cells in the non-dividing cell cluster. (C) (Upper) Distribution of pentagonal patterns of N-cad1 at 45?hpf. A peak shift is observed in both non-dividing and dividing cell populations. Furthermore, the segregation level is more prominent in the N-cadherin morphant. (Bottom) Average number of dividing cell population in non-dividing cell population-centered (blue), dividing cell population-centered (red) pentagonal clusters and random distribution model (black). Values of three N-cadherin morphant lenses are plotted. N-cad1 is indicated by the number 1. Averages and s.d. are indicated by horizontal and vertical bars, respectively. (D,E) Trajectory (D) and displacement (E) of cell movement in N-cad1. (F) (Upper) Cell movement direction in three N-cadherin morphant lenses. A and P indicate the anterior and peripheral regions, respectively. (Bottom) Cell movement direction in anterior and peripheral regions, corresponding to squares marked A and P, in wild-type (black arrows, shown in Fig. 1H) and N-cadherin morphant lenses (blue arrows). The range of cell movement direction of N-cadherin morphants is indicated in blue and is less circumferential than that of the wild type in the peripheral region. (G) Speed of cell movement on trajectory of N-cad1. (H,K,M) Cell movement speed (H), tracking length (K) and displacement (M) of all lens epithelial cells in WT1 and N-cad1. (I,L,N) Cell movement speed (I), tracking length (L) and displacement (N) of non-dividing (ND) and dividing (DV) cell populations in N-cad1 (blue) and WT1 (black). (J) Cell movement speed of G1, S/G2 and M phase cells in N-cad1 (blue) and WT1 (black). The error bars in H-N indicate the s.e.m. Student's t-test: *P<0.05, **P<0.01, ***P<0.005. Scale bars: 10?�m.
|
