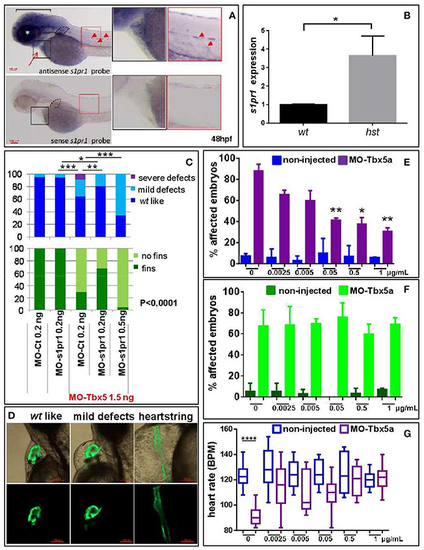
s1pr1 is overexpressed in zebrafish HOS hearts and its downregulation is able to partially rescue heart/fin defects induced by Tbx5 depletion. (A) Examples of s1pr1 ISH performed on 48 hpf embryos. Top left, arrow and arrowheads indicate respectively the hybridization signals at the heart and vascular levels; dotted line encircles fin bud, bracket and asterisk mark respectively the hybridization signal on brain and eye areas Bottom left, control ISH performed with sense s1pr1 probe. Right, magnifications of the cardiac and dorsal areas. Scale bar = 100 μm. (B) Quantification by ddPCR of s1pr1 transcript in hearts dissected from 72 hpf normal and tbx5a296 mutant embryos. Data were normalized on ef1α as internal standard and are relative to wt sets as 1. Three different experiments starting from 3 different clutches were used for this analysis. (C,D) Rescue of Tbx5 morphants by s1pr1 depletion. (C) Analysis of 72hpf Tbx5 morphants. MO-s1pr1 or MO-Ct at the reported doses, were co-injected with 1.5 ng of MO-Tbx5a in Tg(Myl7:EGFP)embryos. For comparison the phenotypes of embryos injected only with MO-s1pr1 or MO-Ct are presented. The percentage of embryos with the indicated heart (top) or pectoral fin (bottom) defects was averaged across multiple independent experiments carried out in double blind. All the comparisons indicated in the heart graph were highly significant in fin graphs (P < 0.0001). The total number of analyzed Tbx5 morphant embryos were as follows: MO-Ct co-injected n = 136 (0.2 ng), n = 137 (0.5 ng); MO-s1pr1 co-injected n = 136 (0.2 ng), n = 203 (0.5 ng). One hundred and fifty embryos were injected only with MO-Ct and 50 only with MO-s1pr1. (D) Some examples of the different cardiac phenotypes obtained in the experiments presented in (C). *p < 0.05, **P < 0.001, ***P < 0.0001. (E–G) Rescue of Tbx5 morphants by s1pr1 chemical inhibition. 2.5 ng of MO-Tbx5a was injected into Tg(Myl7:EGFP)embryos. At 24 hpf, W146 was added at the indicated doses to E3 medium of morphants and non-injected embryos. (E) Cardiac morphology analysis of 72 hpf Tbx5a morphants and non-injected embryos. Affected embryos either had heartstrings morphology, pericardial edema, or looping/chamber defects. The total number of analyzed Tbx5 morphant embryos were as follows: 0 μg n = 51, 0.0025 μg n = 32, 0.005 μg n = 27, 0.05 μg n = 29, 0.5 μg n = 34, 1 μg n = 32. The total number of analyzed non-injected control embryos were as follows: 0 μg n = 28, 0.0025 μg n = 38, 0.005 μg n = 30, 0.05 μg n = 31, 0.5 μg n = 31, 1 μg n = 34. *P < 0.05, **P < 0.001 vs. morphants with 0 μg/mL W146. None the non-injected control embryos treated with W146 showed any significant differences compared to embryos receiving 0 μg/mL W146. (F) Fin analysis of 72 hpf Tbx5a morphants and non-injected embryos. Fins were scored for the presence of both pectoral fins. No statistical differences were observed among drug application groups for either non-injected and Tbx5 morphant embryos, compared to no drug controls. (G) Heart rate analysis of 72 hpf Tbx5a morphants and non-injected embryos. Ten embryos were scored for each group as described in section Materials and Methods.
|

