Fig. 3
- ID
- ZDB-FIG-180821-15
- Publication
- McMillan et al., 2018 - A regulatory pathway involving retinoic acid and calcineurin demarcates and maintains joint cells and osteoblasts in the fin regenerate
- Other Figures
- All Figure Page
- Back to All Figure Page
|
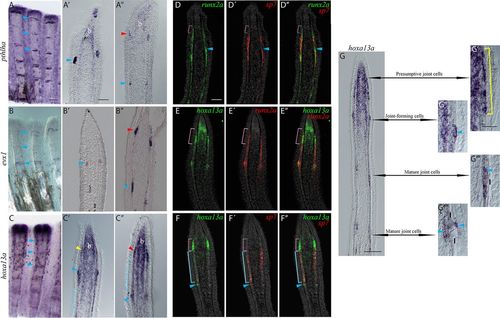
Characterization of the presumptive joint cells. ISH or FISH on whole-mount (A-C) or longitudinal cryosections (A?-G??) at 4?dpa. A?-C? and D-D? show examples of rays without presumptive joint cells as indicated by a distance less than 200??m between the joint-forming cells (blue arrowheads) and the distal edge of the pre-osteoblasts domain (pink brackets in D-D?). A?-C? and E-G?? show examples of rays with presumptive joint cells: the distance between the joint-forming cells (blue arrowheads) and the distal pre-osteoblast domain (pink bracket) is about 254±25??m. (A-C) pthlha (A), evx1 (B) and hoxa13a (C) are expressed in joint regions. (A?-C?) The three markers are expressed in joint-forming cells and mature joints (blue arrowheads). Yellow arrowhead in C? indicates pre-osteoblasts that lightly express hoxa13a. (A?-C?) An additional elongated domain of pthlha (A?), evx1 (B?) and hoxa13a (C?) expression (red arrowheads) is observed distal to the joint-forming cells (blue arrowheads) in some rays. hoxa13a is also weakly expressed in newly committed osteoblasts (blue brackets in C?,C?). hoxa13a and pthlha are expressed in the blastema (A-A?,C-C?). (D-D?) A group of runx2a+/sp7? pre-osteoblasts (pink brackets) is present distal to the sp7-expressing committed osteoblasts. (E-E?) Strong hoxa13a expression colocalizes with the distal edge of the runx2a-expressing pre-osteoblasts (pink brackets). (F-F?) Presumptive joint cells (pink brackets) and joint-forming cells (blue arrowheads) that strongly express hoxa13a lack sp7 expression (pink brackets). However, hoxa13a is weakly expressed in newly committed sp7+ osteoblasts (blue brackets). (G) ISH for hoxa13a expression illustrating changes in cell morphology as joints mature. (G?) The presumptive joint cell hoxa13a expression domain possesses an elongated shape (yellow bracket). (G?) The more proximal and mature ?joint-forming cells? form a round cluster (blue arrowhead) that is distinct from osteoblasts. (G?-G??) hoxa13a expression persists in mature joint cells, which are located first on the internal side (G?), then on both internal and external sides (G??) of the lepidotrichia (blue arrowheads). b, blastema; l, lepidotrichia. Scale bars: 200??m (in A for A-C); 50??m (in A? for A?-C?); 50??m (in D for D-F); 100??m (G); 30??m (in G? for G?-G??). |
| Genes: | |
|---|---|
| Fish: | |
| Condition: | |
| Anatomical Terms: | |
| Stage: | Adult |

