
Fig. 2
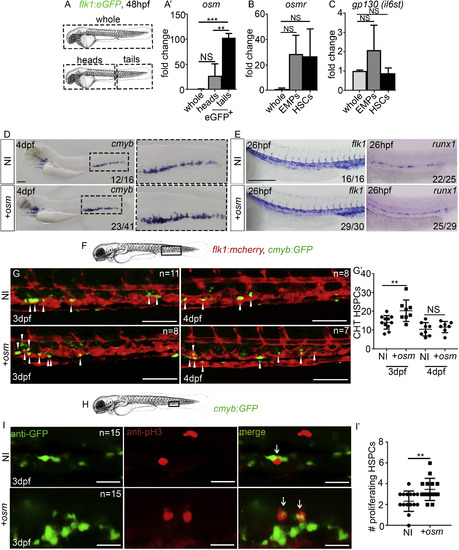
osm Expands HSCs within the CHT Niche (A and A′) Experimental outline and qPCR expression of osm from whole zebrafish or FACS-sorted ECs. Data are biological triplicates plated in technical duplicates. (B and C) qPCR expression of osm, osmr, and gp130 (il6st in zebrafish) in whole zebrafish or FACS-sorted hematopoietic progenitors (EMPs and HSCs). All qPCR data are from biological triplicates. In (A′), (B), and (C), analysis was performed by a one-way ANOVA with multiple comparisons. In (A′), whole and heads, p = 0.16; whole and tails, p = 0.0004; heads and tails, p = 0.0019. In (B), whole and EMPs, p = 0.17; whole and HSCs, p = 0.14. In (C), whole and EMPs, p = 0.22; whole and HSCs, p = 0.98. (D and E) ISH expression of cmyb, flk1, and runx1 following injection of full-length osm mRNA (injected at 300 pg here and throughout, unless otherwise stated) or in non-injected embryos. Scale bar, 100 μm. (F) Imaging area. (G and G′) Imaging double transgenic flk1:mCherry/cmyb:GFP embryos at 3 and 4 dpf. Arrowheads represent HSCs embedded in the CHT niche. Scale bar, 100 μm. In (G′), between NI and osm injected at 3 dpf, p = 0.0097, and at 4 dpf, p = 0.4894. (H) Imaging area. (I and I′) anti-GFP and pH3 immunofluorescence at 3 dpf in cmyb:eGFP embryos. Arrows represent double-positive, proliferating cells. Scale bar, 25 μm. Analysis was performed by an unpaired, two-tailed Student's t test in (G′) and (I′). In (I′), p = 0.0050. NI, non-injected control. +osm, osm full-length mRNA-injected embryos. All data are means ± SD ∗∗∗p < 0.001, ∗∗p < 0.01, NS, p > 0.05. |
| Genes: | |
|---|---|
| Antibody: | |
| Fish: | |
| Anatomical Terms: | |
| Stage Range: | Prim-5 to Day 4 |