
Fig. S7
- ID
- ZDB-FIG-180803-22
- Publication
- Takayama et al., 2018 - Leucine/glutamine and v-ATPase/lysosomal acidification via mTORC1 activation are required for position-dependent regeneration
- Other Figures
- All Figure Page
- Back to All Figure Page
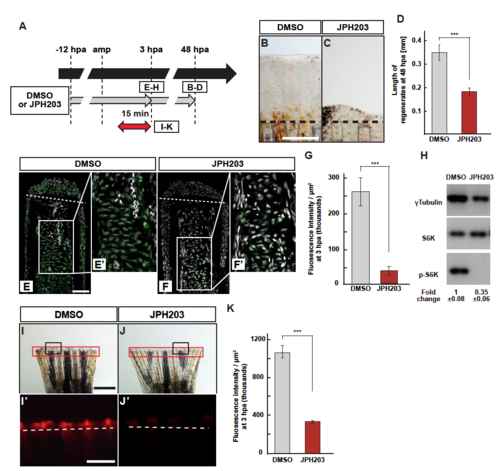
S6K activation and lysosomal acidification are inhibited by JPH203. (A) Scheme of JPH203 (Slc7a5-specific inhibitor) treatment from -12 to 3 or 48 hpa. A red two-headed-arrow indicates LysoTracker treatment, which was applied 15 min before observation. (B-D) Outgrowth of fin regenerates and quantification of their length in control or JPH203-treated fin regenerates at 48 hpa (n = 5). Representative images (B and C) used for quantification are shown in D. Black dashed lines indicate the amputation planes. Scale bars: 250�m. ***p < 0.001 by Student?s t test. Error bars represent the standard error. (E-G) Longitudinal ray sections and quantification of p-S6K fluorescence intensities per area that consists of the whole regenerates and 500 ?m below the amputation plane in DMSO- or JPH203-treated fin regenerates at 3 hpa; p-S6K and nuclei were visualized by immunohistochemical staining and DAPI staining, respectively (n = 5). Representative images (E-F?) used for quantification are shown in G. White dashed lines indicate the amputation planes. Scale bars: 50�m (E and F) and 25�m (E? and F?). ***p < 0.001 by Student?s t test. Error bars represent the standard error. (H) Western blot analysis of ?Tubulin, S6K, and p-S6K in the DMSOor JPH203-treated fin stumps (n = 6). ?Tubulin serves as a loading control. Numbers below each lane show the level of p-S6K in JPH203-treated fin stumps relative to that in DMSO-treated fin stumps at 3 hpa normalized to loading control. (I-K) Images of bright-field and fluorescence microscopy, and quantification of LysoTracker fluorescence intensities in DMSO- or JPH203-treated fins at 3 hpa (n = 8). Black boxed areas in I and J are enlarged in I? and J?, respectively. The LysoTracker fluorescence intensities in red boxed areas were measured (I-J?). Representative images (I?-J?) used for quantification are shown in K. White dashed lines indicate the amputation planes. Scale bars: 1 mm (I and J) and 500�m (I? and J?). ***p < 0.001 by Student?s t test. Error bars represent the standard error. |