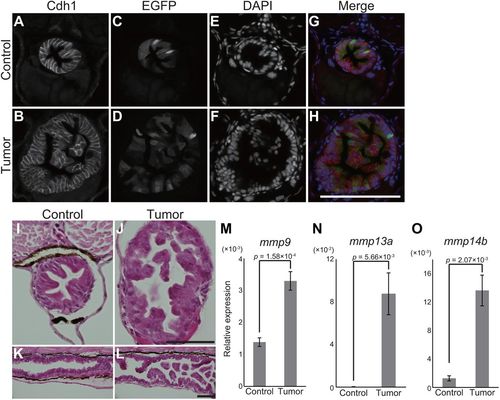
pInt-Gal4 driven krasG12D expression results in intestinal epithelial tumor. (A-H) Representative images of fluorescent immunohistochemistry for Cdh1 in transversal sections of the posterior intestine of the sibling controls and tumor-bearing larvae at 5?dpf. Cdh1 (A,B), EGFP (C,D) and DAPI (E,F) images are shown. In the merged images (G,H), Cdh1, EGFP and DAPI signals are shown in red, green and blue, respectively. Scale bar: 100?�m. (I-L) Representative images of HE-stained intestinal sections of the sibling controls (I,K) and tumor-bearing larvae (J,L) at 5?dpf. Transversal and sagittal sections are shown in I,J and K,L, respectively. Scale bars: 50?�m. (M-O) qPCR analysis for mmp genes in the intestine at 9?dpf. The scores are normalized to expression of rpl13a. The data harbors 5 biological replicates, each containing the intestines from 5 larvae. Error bars represent means�s.e.m. Statistical significance was tested using Student's t-test (unpaired, one-tailed). Data are representative of at least two independent experiments.
|
