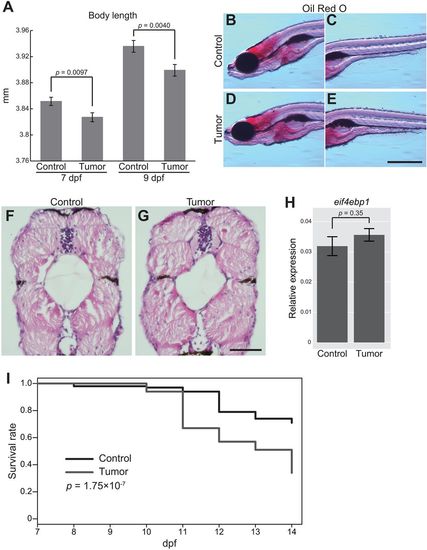
The zebrafish intestinal tumor causes the systemic growth defect and organismal death. (A) Body length data of the sibling controls and tumor-bearing larvae at 7 and 9?dpf. The number of larvae used is 163 (7?dpf control larvae), 155 (7?dpf tumor-bearing larvae), 154 (9?dpf control larvae) and 154 (9?dpf tumor-bearing larvae). Data from three independent clutches are pooled. Data from each clutch are shown in Fig. S6. Error bars represent means�s.e.m. Statistical significance was tested using Student's t-test (unpaired, two-tailed). (B-E) Representative images of Oil Red O staining for the sibling controls (B,C) and tumor-bearing larvae (D,E) at 9?dpf. Scale bar: 500?�m. Red-stained areas represent total lipids in larvae. (F,G) Representative images of HE-stained transversal body sections for the sibling controls (F) and tumor-bearing larvae (G) at 9?dpf. Scale bar: 50?�m. (H) qPCR analysis for eif4ebp1 in the body (without the intestine or intestinal tumor) in the sibling controls and tumor-bearing larvae at 9?dpf. Scores are normalized to expression of rpl13a. The data harbors 5 biological replicates, each containing 5 larvae. Error bars represent means�s.e.m. Statistical significance was tested using Student's t-test (unpaired, two-tailed). (I) Survival rates of the sibling controls and tumor-bearing larvae from 7 to 14?dpf are shown by the Kaplan?Meier curve. Data were pooled from three independent experiments. The total number of analyzed larvae is 100 each. Statistical significance was tested using the log-rank test. Data are representative of at least two independent experiments, except I.
|
