
Fig. 5
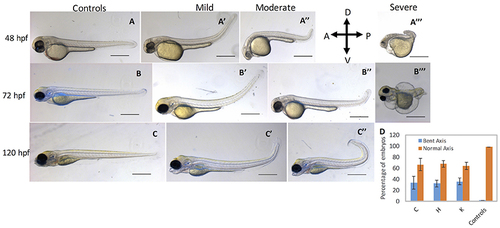
cbsb CRISPR embryos show axis defects. Control flk:EGFP CASPER embryos are shown at 48 hpf (A), 72 (B), and 120 hpf (C). cbsb CRISPR embryos are shown at 48 hpf (A?-A? ), 72 hpf (B?-B? ), and 120 hpf (C?,C?). Mild, medium, and severe phenotypes are shown for each time point for the cbsb CRISPR embryos except at 120 hpf. Panel (D) shows quantification of the axis defects in three independent CRISPR lines (C, H, and K) and comparison of the axis defects with control flk:EGFP CASPER line. Y axis shows the average of the percentage of embryos from five experiments with bent axis and normal axis. n = 311 embryos for C line, n = 236 embryos for H line, n = 241 embryos for K line and n = 311 embryos for the control flk:EGFP CASPER line which are total number of embryos from five independent experiments. To perform statistical analysis, embryos showing any degree of bent axis phenotype (mild, medium, or severe) have been grouped together into one category called bent axis. *P < 0.05 for comparison of percent embryos with bent axis between controls and CRISPR line C, ***P < 0.001 for comparison of percent embryos with bent axis between controls and CRISPR line H and ***P < 0.001 for comparison of percent embryos with bent axis between controls and CRISPR line K. In the figure panels, the embryo orientation is left is anterior (A) and right is posterior (P) while top is dorsal (D) and bottom is ventral (V). Scale bars in the 48 and 72 hpf panels indicate 0.25 mm; scale bars in 120 hpf panels (C?C?) are 0.4 mm. Error bars indicate standard error of the mean of five experiments. |
| Fish: | |
|---|---|
| Observed In: | |
| Stage: | Long-pec |