
Fig. 3
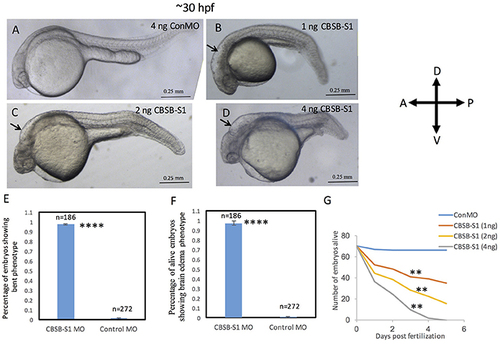
Dose-dependent effect of cbsb morpholinos at 30 hpf. Phase contrast images of 30 hpf embryos injected with 4 ng of control (Con) MO (A); 1 ng cbsb splice1 (CBSB-S1) MO (B); 2 ng (CBSB-S1) (C) and 4 ng (CBSB-S1) (D) are shown. Arrow shows brain edema. Panels (E,F) quantifies the number of CBSA-S1 MO-injected embryos displaying bent axis, and brain edema (black arrows) compared to ConMO-injected embryos. n = 186 surviving embryos for CBSB-S1 MO and n = 272 surviving embryos for ConMO, which were a total of four experiments ****P < 0.0001 for both bent axis phenotype and brain edema phenotype. (G) Percentage survival observed over a 5 day period for three different doses of CBSB-S1-injected (1 ng, n = 70; 2 ng, n = 70; 4 ng, n = 70) and ConMO-injected embryos (4 ng, n = 70), n = 6 time points, **P < 0.01 for comparison between ConMO and each of the respective CBSB-S1 MO doses. Scale bars indicate 0.25 mm. |
| Fish: | |
|---|---|
| Knockdown Reagents: | |
| Observed In: | |
| Stage Range: | Prim-15 to Day 6 |