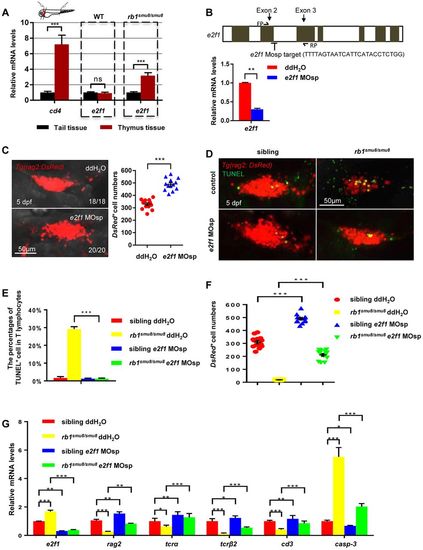
The excessive apoptosis of early T lymphocytes in the thymus of rb1smu8/smu8 mutants is e2f1 mediated. (A) Relative expression of e2f1 in excised thymus and tail tissue from 5 dpf embryos by qPCR analysis (mean�s.e.m.; ***P<0.001; ns, not significant; n=30). (B) The zebrafish e2f1 gene structure. Exons are indicated by grey boxes. Location and sequence of the splice morpholino (MOsp) target site for the e2f1 gene. FP/RP, e2f1 qPCR forward/reverse primers. Relative expression of e2f1 in controls and e2f1 morphants at 5?dpf by qPCR analysis (mean�s.e.m.; **P<0.01; n=30). (C) Confocal images of rag2:DsRed cells in the thymus of wild-type embryos injected with double distilled H2O or e2f1 MOsp at the one-cell stage with rag2:DsRed+ cell number measured at 5?dpf. Scale bars: 50??m. Quantification of rag2-DsRed+ cells (right panel) (mean�s.e.m.; ***P<0.001; n=13). (D) Confocal images of T cells (red) exhibiting cell apoptosis (overlap of TUNEL staining) in siblings and rb1smu8/smu8 mutant embryos injected with double distilled H2O or e2f1 MOsp at 5?dpf. Scale bars: 50??m. (E) Percentages of T cells (red) exhibiting cell apoptosis (overlap of TUNEL staining) in siblings and rb1smu8/smu8 mutant embryos injected with double distilled H2O or e2f1 MOsp at 5?dpf (mean�s.e.m.; ***P<0.001; n=20). (F) Quantification of rag2-DsRed+ cell shown in D (mean�s.e.m.; ***P<0.001; n=10). (G) qPCR analysis of e2f1, rag2, tcra, tcrb, cd3 and casp3 expression in mutants injected with double distilled H2O or e2f1 MOsp at 5?dpf (mean�s.e.m.; ***P<0.001, **P<0.01 *P<0.05; n=30).
|
