
Fig. S2
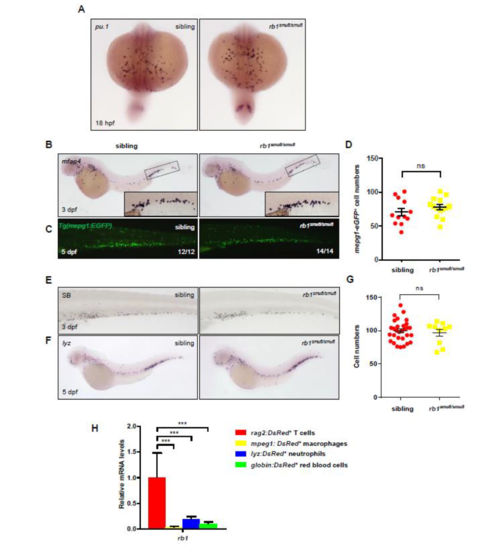
Myeloid cells development was largely unaffected in rb1smu8/smu8 mutant zebrafish. (A) pu.1 WISH staining shows normal myeloid progenitors in the RBI regions of 18 hpf rb1smu8/smu8 mutants compared to siblings. (B and C) mfap4 WISH staining at 3 dpf, and mepg1:EGFP immunochemistry staining at 5 dpf rb1-deficient embryos shows normal development of peripheral macrophages. (D) Quantifications of mepg1+ cells at 5 dpf sibling and rb1-deficient embryos. Error bars represent mean�SEM. ns, not significant. (E and F) Sudan Black (SB) staining at 3 dpf, and lyz WISH staining at 5 dpf rb1-deficient embryos shows normal development of neutrophil. (G) Quantifications of lyz+ cells at 5 dpf sibling and rb1-deficient embryos in the CHT regions. Error bars represent the mean � SEM; ns, not significant. (H) qPCR analysis of rb1 in different lineages of hematopoietic cells. Fluorescent cells were sorted from 5-dpf transgenic larvae. rag2:DsRed+: lymphocytes; mpeg1:DsRed+: macrophages; lyz:DsRed+: neutrophils; globin:DsRed+: red blood cells. |