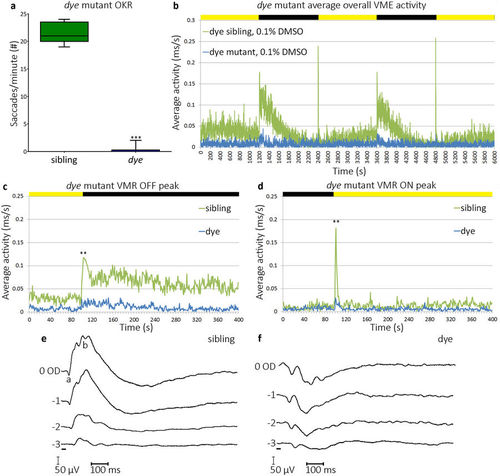
dye mutants exhibit reduced/absent visual behaviour. (a) dye mutants have a reduced/absent OKR compared to unaffected siblings, data represented using a box and whiskers plot, N?=?15 (number of larvae per replicate), n?=?3 (number of replicates). (b?d) Average overall VMR activity of dye mutants (blue trace) and siblings (green trace), through the 1 h 40?minute experiment (b), graph depicts average activities of 12 larvae in 3 separate replicates. Peak activity in response to a transition from light to dark (c), and dark to light (d). Graphs in c and d depict the average activity from 2 transitions in one experiment and the average across 3 separate replicates, yellow and black bars represent dark and light periods. N?=?12, n?=?3 for VMR assays. Electroretinograms (e,f) depict sibling and dye responses to 20 ms flashes (black bar) at increasing light intensities (?3.0, ?2.0, ?1.0 and 0 optical densities), with a maximum light intensity of 2.8?�?103?�W/cm2. Statistical analysis was carried out using a student?s t-test with unequal variances, ***p?<?0.001, **p?<?0.01.
|
