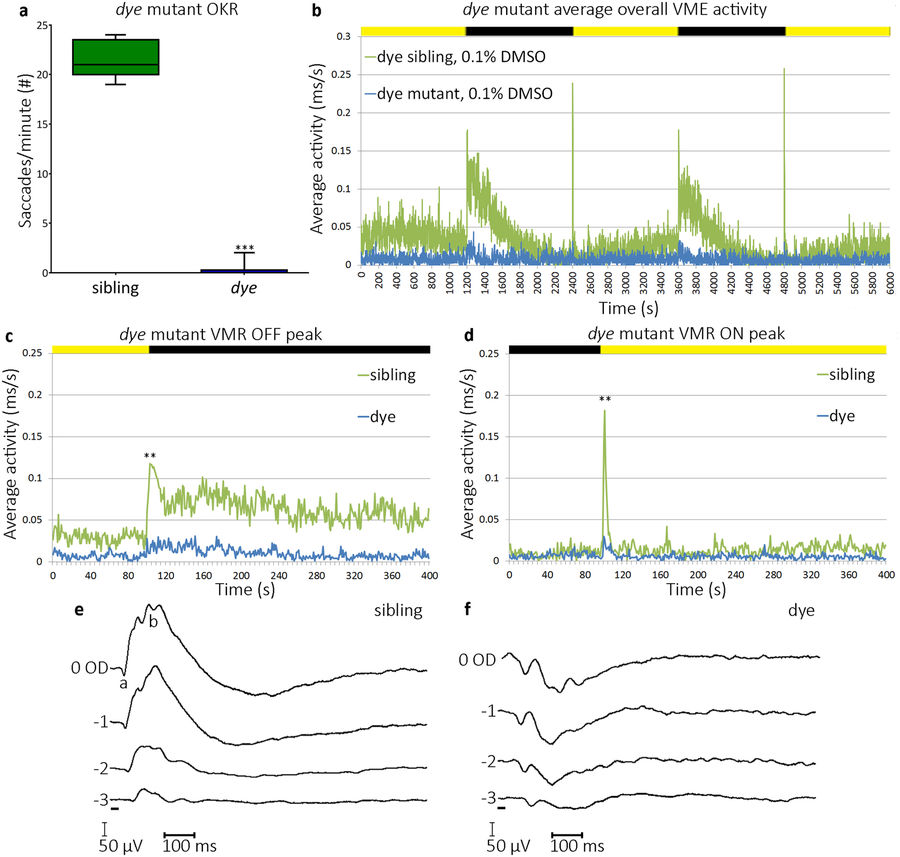
Fig. 2 dye mutants exhibit reduced/absent visual behaviour. (a) dye mutants have a reduced/absent OKR compared to unaffected siblings, data represented using a box and whiskers plot, N?=?15 (number of larvae per replicate), n?=?3 (number of replicates). (b?d) Average overall VMR activity of dye mutants (blue trace) and siblings (green trace), through the 1 h 40?minute experiment (b), graph depicts average activities of 12 larvae in 3 separate replicates. Peak activity in response to a transition from light to dark (c), and dark to light (d). Graphs in c and d depict the average activity from 2 transitions in one experiment and the average across 3 separate replicates, yellow and black bars represent dark and light periods. N?=?12, n?=?3 for VMR assays. Electroretinograms (e,f) depict sibling and dye responses to 20 ms flashes (black bar) at increasing light intensities (?3.0, ?2.0, ?1.0 and 0 optical densities), with a maximum light intensity of 2.8?×?103?µW/cm2. Statistical analysis was carried out using a student?s t-test with unequal variances, ***p?<?0.001, **p?<?0.01.
Image
Figure Caption
Figure Data
Acknowledgments
This image is the copyrighted work of the attributed author or publisher, and
ZFIN has permission only to display this image to its users.
Additional permissions should be obtained from the applicable author or publisher of the image.
Full text @ Sci. Rep.

