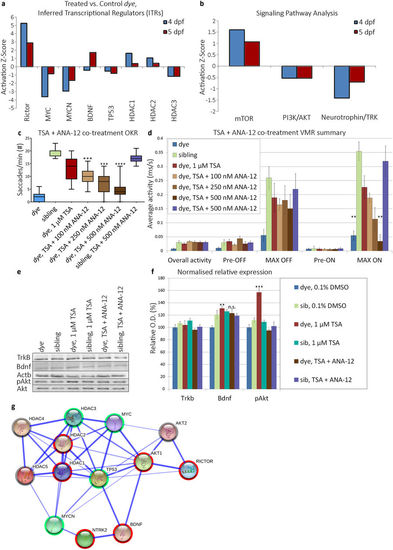
Identification and validation of HDACi mediated rescue pathway. (a) Activation/inhibition z-score plot of inferred transcriptional regulators (ITRs) in response to TSA treatment, at 4 and 5 dpf treatment end points in the dye mutant. ITRs were inferred by IPA from the HDAC inhibitor LC/MS:MS data. (b) Activation/inhibition z-score plot of identified HDACi modulated pathways, activation status is determined by abundance of downstream effector proteins present in the LC/MS:MS dataset. (c,d) Visual behaviour assay responses following co-treatment of TSA and ANA-12, an antagonist of the TrkB receptor, ANA-12 co-treatment results in a dose-dependent reduction in OKR (c). (d) Summary of VMR activity, ANA-12 co-treatment results in a dose-dependent reduction in the MAX ON response, changes in visual behaviour are compared to TSA only treated dye larvae, statistical analysis was performed using a Kruskal-Wallis one-way analysis of variance and post-hoc Dunn?s multiple comparison test, comparing each group to TSA only treated dye mutants. (e,f) Validation of differential expression of Bdnf, TrkB and effectors in the signaling pathway in 25 pooled eyes by western blot. TSA treatment increased expression of Bdnf, but not Trkb and this expression pattern was not affected by ANA-12 co-treatment. Akt (Thr308) phosphorylation was increased in TSA treated dye, while levels remained unchanged in ANA-12 co-treated larvae, N?=?25 (number of eyes per replicate), n?=?3 (number of replicates). Images represent a typical blot, bar chart represents signal intensity measured by densitometry, Trkb and Bdnf signals normalised to Actb expression and pAKT (Thr308) signal normalised to total Akt. Statistical analysis was performed using a two-tailed unpaired t-test in comparison to dye control. Error bars indicate S.E.M, ****p?<?0.0001 ***p?<?0.001, **p?<?0.01. Full length western blots are included in supplementary information (Supplementary Fig. S3e?i). (g) Protein interaction map (generated by STRING-DB) of ITRs differentially expressed upon TSA treatment. Akt1, Akt2 and TrkB proteins were added to the network based on ITR pathway analysis and western blot data. Activated nodes are highlighted with red, downregulated nodes with green, grey highlighted nodes are predicted regulators but in which the direction is unknown.
|

