
FIGURE
Fig. S2
Fig. S2
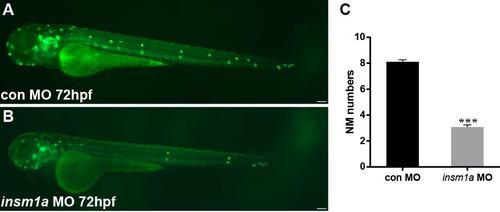
Insm1a knockdown shows a reduction in the number of pLL neuromasts. (A,B) Fluorescent images of cldnb:lynGFP embryos at 72 hpf injected with control-MO and insm1a-MO. Scale bars: 100 ?m. (C) Quantification of the number of neuromasts along the body at 72 hpf in control-MO (n = 20) and insm1a-MO (n = 38). ***p < 0.001. |
Expression Data
Expression Detail
Antibody Labeling
Phenotype Data
| Fish: | |
|---|---|
| Knockdown Reagents: | |
| Observed In: | |
| Stage: | Protruding-mouth |
Phenotype Detail
Acknowledgments
This image is the copyrighted work of the attributed author or publisher, and
ZFIN has permission only to display this image to its users.
Additional permissions should be obtained from the applicable author or publisher of the image.
Full text @ Front. Mol. Neurosci.