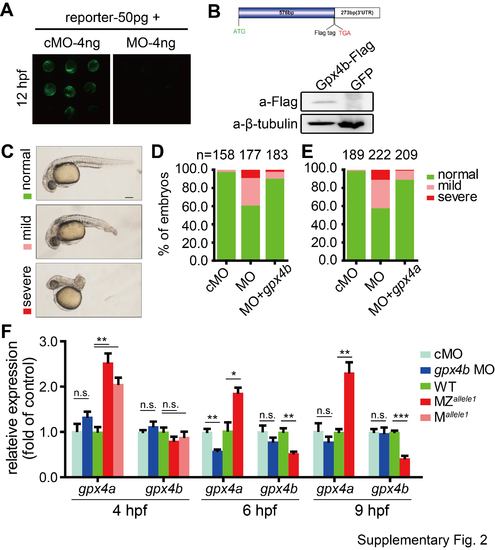
Fig. S2
- ID
- ZDB-FIG-170602-18
- Publication
- Rong et al., 2017 - Glutathione peroxidase 4 inhibits Wnt/?-catenin signaling and regulates dorsal organizer formation in zebrafish embryos
- Other Figures
- All Figure Page
- Back to All Figure Page
|
Knockdown of gpx4b results in dorsalized embryos and loss of gpx4b upregulates the expression of gpx4a. (A) Effectiveness of the MO used. Fluorescence micrographs of zebrafish embryos at 12 hpf injected with the gpx4b-5'-UTR reporter plasmid DNA (50 pg) and control MO (cMO, 4 ng) or gpx4b-targeting MO (MO, 4 ng). (B) Validation of the Gpx4b expression plasmid used. Top: Schematic representation of the constructed expression plasmid. A Flag tag was inserted just before the stop codon of the ORF. Bottom: Western blot showing the expression of Flag-tagged Gpx4b. The Flag-tagged Gpx4b expression vector was transfected into HEK293T cells, and lysates were analyzed by immunoblotting with an anti-Flag antibody. GFP expression vector was used as a negative control. (C) Classification of phenotypes caused by MO-mediated knockdown of gpx4b. Representative images of zebrafish embryos at 26 hpf injected with 6 ng control MO (cMO), 6 ng MO, or 6 ng MO plus 50 pg gpx4b mRNA (MO+gpx4b). Lateral views with anterior to the left. Scale bar = 200 ?m. (D) Percentages of embryos in each category as shown in C. (E) The antagonizing effect of Gpx4a to gpx4b knockdown in zebrafish embryos. One-cell stage embryos were injected with 6 ng gpx4b MO alone or 6 ng gpx4b MO plus 50 pg gpx4a mRNA. The phenotypes of injected embryos were scored and presented following the criteria shown in C. The results are from three independent experiments and the total embryo numbers are given at the top. (F) The transcript levels of gpx4a and gpx4b in gpx4b WT (WT and cMO), mutant (M and MZ), and morphant (MO) embryos at indicated stages. 6 ng cMO or gpx4b MO were injected at one-cell stage. Each group of embryos were raised and collected at indicated stage, the transcript levels of gpx4a and gpx4b were then measured by qRT-PCR. Values are meansąs.e.m. (n = 3). *P < 0.05; **P < 0.01; ***P < 0.001; n.s., not significant. Unpaired t test, Two-tailed. |

