
Fig. S7
- ID
- ZDB-FIG-170104-21
- Publication
- Jiménez-Amilburu et al., 2016 - In Vivo Visualization of Cardiomyocyte Apicobasal Polarity Reveals Epithelial to Mesenchymal-like Transition during Cardiac Trabeculation
- Other Figures
- All Figure Page
- Back to All Figure Page
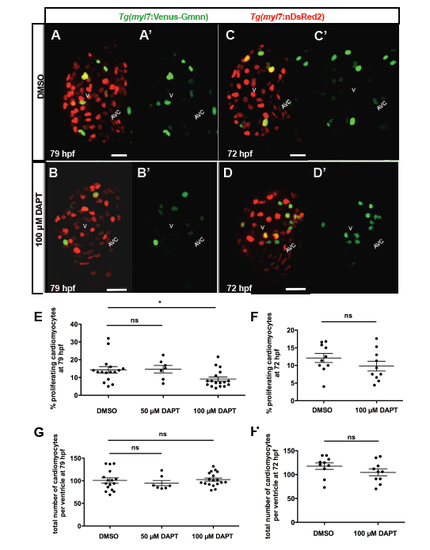
DAPT treatment does not affect cardiomyocyte proliferation during trabeculation (A-D') 3D spinning disk images at mid-sagittal plane of 79 (A-B') and 72 (C-D') hpf Tg(myl7:nDsRed2);Tg(myl7:mVenus-gmnn) zebrafish hearts. DMSO-treated larvae showing myl7:mVenus-gmnn positive cardiomyocytes at 79 (A-A') and 72 (C-C') hpf. Embryos treated with 100 ?M DAPT starting at 48 and imaged at 79 (BB') hpf or starting at 60 and imaged at 72 (D-D') hpf showing myl7:mVenus-gmnn positive cardiomyocytes. (E, F) Graphs showing the percentage of proliferating cardiomyocytes after treating with 50 or 100 ?M DAPT at 48 (E) or 100 ?M DAPT at 60 (F) hpf. Each dot represents one heart. (G, H) Graphs showing the total number of cardiomyocytes per ventricle after treating with 50 or 100 ?M DAPT at 48 (G) or 100 ?M DAPT at 60 (H) hpf. Each dot represents one heart. V, ventricle; AVC, atrioventricular canal. Scale bars, 20 ?m. |