
Fig. 3
- ID
- ZDB-FIG-160316-23
- Publication
- Xu et al., 2016 - Four and a Half LIM Domains 1b (Fhl1b) Is Essential for Regulating the Liver versus Pancreas Fate Decision and for ?-Cell Regeneration
- Other Figures
- All Figure Page
- Back to All Figure Page
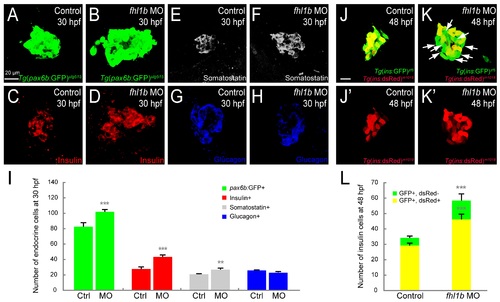
Decreased Fhl1b activity augments induction of pancreatic endocrine cells. (A-H) Confocal images showing Tg(P0-pax6b:GFP)ulg515 (A and B, green), Insulin (C and D, red), Somatostatin (E and F, grey), and Glucagon (G and H, blue) expression at 30 hpf, comparing control embryos (A, C, E, and G) and fhl1b morphants (B, D, F, and H). The number of Tg(P0-pax6b:GFP)ulg515 (B)- and Insulin (D)-expressing cells was significantly increased in fhl1b morphants compared to that of control embryos (A and C, respectively). The number of Somatostatin-expressing cells was also increased (F), while that of Glucagon-expressing cells appeared unaffected (H) in fhl1b morphants compared to that of control embryos (E and G, respectively). (I) Quantification of the number (mean�SD) of total and individual pancreatic endocrine hormone-expressing cells, comparing that of control embryos and fhl1b morphants at 30 hpf. The absolute number of Tg(P0-pax6b:GFP)ulg515-, Insulin-, and Somatostatin-expressing cells was increased from 82.6�4.5, 30.6�1.5, and 20.7�0.8, respectively, in control embryos, to 103�2.0, 44.6�2.0, and 26.7�2.0, respectively, in fhl1b morphants, while that of Glucagon-expressing cells appeared unaffected (26.5�0.7 cells in controls vs. 24.6�1.5 cells in fhl1b morphants). Cells in 20 planes of confocal images from 5 individual embryos were counted. Asterisks indicate statistical significance: **, P < 0.01; ***, P < 0.001. (J-K′) Confocal images of Tg(ins:GFP)zf5;Tg(ins:dsRed)m1018 control embryos (J and J′) and fhl1b morphants (K and K′) at 48 hpf. Compared with the control embryos (J), fhl1b morphants showed an increased number of GFP-only-positive β-cells (K, white arrows). (L) Quantification of the number (mean�SD) of GFP- and dsRed-double positive (yellow) and GFP-only-positive (green) β-cells, comparing that of control embryos and fhl1b morphants at 48 hpf. In control embryos, 5.0�0.7 β-cells were GFP-only-positive, while 12.2�2.3 β-cells were GFP-only-positive in fhl1b morphants. Cells in 20 planes of confocal images from 5 individual embryos were counted. Asterisks indicate statistical significance: ***, P < 0.001. A-H and J-K′, confocal projection images, ventral views, anterior to the top. Scale bars, 20 �m. |
| Genes: | |
|---|---|
| Antibody: | |
| Fish: | |
| Knockdown Reagents: | |
| Anatomical Terms: | |
| Stage Range: | Prim-15 to Long-pec |
| Fish: | |
|---|---|
| Knockdown Reagents: | |
| Observed In: | |
| Stage Range: | Prim-15 to Long-pec |