
FIGURE
Fig. 6
Fig. 6
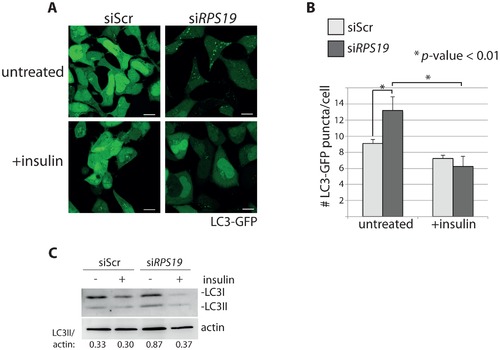
Insulin abolishes autophagy in cells with RPS19 loss. (A) Confocal microscopy analysis of GFP-LC3 HEK cells transfected with siScr or siRPS19 and either untreated or stimulated with 350 nM insulin for 6 hours. Size bars = 10 μM. (B) Quantification of the average number of GFP-LC3 puncta per cell in (A). (C) Western blot analysis of LC3 expression in cells from (A). Densitometer analysis used to calculate the ratio of LC3II/actin. |
Expression Data
Expression Detail
Antibody Labeling
Phenotype Data
Phenotype Detail
Acknowledgments
This image is the copyrighted work of the attributed author or publisher, and
ZFIN has permission only to display this image to its users.
Additional permissions should be obtained from the applicable author or publisher of the image.
Full text @ PLoS Genet.