
Fig. 7
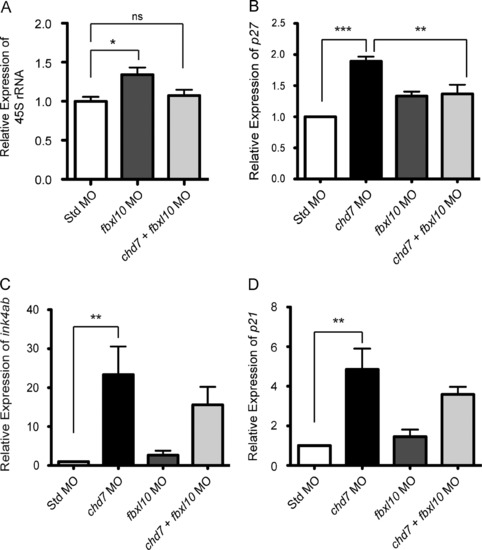
Gene expression changes in cell-cycle regulators in chd7/fbxl10 double morphants. (A) Expression of pre-rRNA in chd7/fbxl10 double morphants and fbxl10 single morphants (re-plotted for comparison from Fig. 5H) relative to Std morphants at 8 hpf (n=3). (B-D) Graphs of qRT-PCR data measuring gene expression of several cell cycle regulator genes at 25 hpf across the panel of morphant embryos relative to Std morphants (n=5-6). Expression data for chd7 morphants re-plotted here from Fig. 4 F-H for comparison. Error bars represent SEM. Significance for all graphs was determined with a Student′s two-tailed t-test and significant values are noted p<0.05 (*), p<0.01 (**), p<0.001 (***). |
| Genes: | |
|---|---|
| Fish: | |
| Knockdown Reagents: | |
| Anatomical Term: | |
| Stage Range: | 1-cell to Prim-5 |
Reprinted from Developmental Biology, 382(1), Balow, S.A., Pierce, L.X., Zentner, G.E., Conrad, P.A., Davis, S., Sabaawy, H.E., McDermott, B.M., and Scacheri, P.C., Knockdown of fbxl10/kdm2bb rescues chd7 morphant phenotype in a zebrafish model of CHARGE syndrome, 57-69, Copyright (2013) with permission from Elsevier. Full text @ Dev. Biol.