
FIGURE
Fig. 5
- ID
- ZDB-FIG-130802-7
- Publication
- Wang et al., 2013 - Subtractive phage display technology identifies zebrafish marcksb that is required for gastrulation
- Other Figures
- All Figure Page
- Back to All Figure Page
Fig. 5
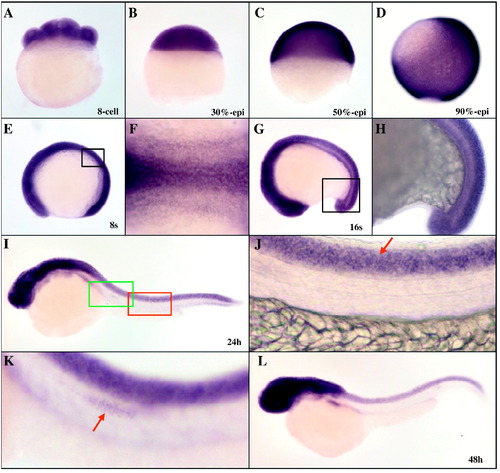
Whole-mount in situ hybridization analysis of zebrafish marcksb during early development. A: 8-cell stage; B: 30%-epiboly stage; C: 50% epiboly stage; D: 90% epiboly stage; E and F: 8 somites stage; G and H: 16 somites stage; I-K: 24 hpf; L: 48 hpf. J: partial enlargement of panel I, arrow indicates the spinal cord; K: partial enlargement of panel I, arrow indicates the lateral line progenitor neurons. Embryos in A -D were lateral view with dorsal to the right, embryos in E, G-L were lateral view with dorsal to the top, and embryo in F was dorsal view with anterior to the left. |
Expression Data
| Gene: | |
|---|---|
| Fish: | |
| Anatomical Terms: | |
| Stage Range: | 8-cell to Long-pec |
Expression Detail
Antibody Labeling
Phenotype Data
Phenotype Detail
Acknowledgments
This image is the copyrighted work of the attributed author or publisher, and
ZFIN has permission only to display this image to its users.
Additional permissions should be obtained from the applicable author or publisher of the image.
Reprinted from Gene, 521(1), Wang, Y.W., Wei, C.Y., Dai, H.P., Zhu, Z.Y., and Sun, Y.H., Subtractive phage display technology identifies zebrafish marcksb that is required for gastrulation, 69-77, Copyright (2013) with permission from Elsevier. Full text @ Gene