
FIGURE
Fig. 2
- ID
- ZDB-FIG-130306-17
- Publication
- Santos-Ledo et al., 2013 - Comparative gene expression analysis of the fmnl family of formins during zebrafish development and implications for tissue specific functions
- Other Figures
- All Figure Page
- Back to All Figure Page
Fig. 2
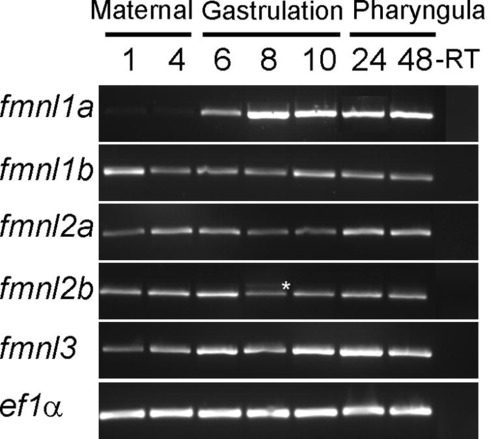
Temporal analysis of zebrafish fmnls using RT-PCR.* indicates alternative splice variant of fmnl2b detected in mid-gastrula stage embryos. This variant includes an additional exon between exons 11 and 12. |
Expression Data
| Genes: | |
|---|---|
| Fish: | |
| Anatomical Term: | |
| Stage Range: | 4-cell to Long-pec |
Expression Detail
Antibody Labeling
Phenotype Data
Phenotype Detail
Acknowledgments
This image is the copyrighted work of the attributed author or publisher, and
ZFIN has permission only to display this image to its users.
Additional permissions should be obtained from the applicable author or publisher of the image.
Reprinted from Gene expression patterns : GEP, 13(1-2), Santos-Ledo, A., Jenny, A., and Marlow, F.L., Comparative gene expression analysis of the fmnl family of formins during zebrafish development and implications for tissue specific functions, 30-37, Copyright (2013) with permission from Elsevier. Full text @ Gene Expr. Patterns