
Fig. S1
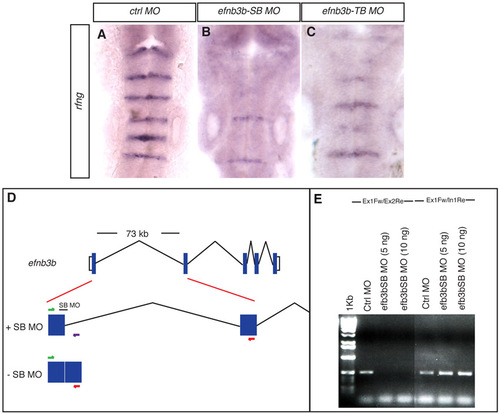
Validation of ephrin B3b MO knockdown. (A-C) rfng expression at 21 ss after injection of control MO (A), efnb3b-SB MO (B) or efnb3b-TB MO (C). There is a loss of boundary marker expression selectively at the r2/r3, r3/r4 and r5/r6 borders following injection of efnb3b-SB (82%, n=23) or of efnb3b-TB (82%, n=17). (D) The efnb3b gene and the different RNA products obtained following injection of control MO or efnb3b-SB MO. (E) Agarose gel electrophoresis of Ex1Fw-Ex2Re (left side) and Ex1Fw-In1Re (right side) RT-PCR products for embryos injected with Ctrl MO, efnb3b-SB (5 ng) and efnb3b-SB (10 ng). The exon 1-exon 2 RT-PCR product seen in control MO embryos is absent when injected with either concentration of efnb3b-SB (the 73 kb intron 1 is too large to amplify) and there is a concurrent increase in the amount of exon 1-intron 1 RT-PCR product. |