Fig. S4
|
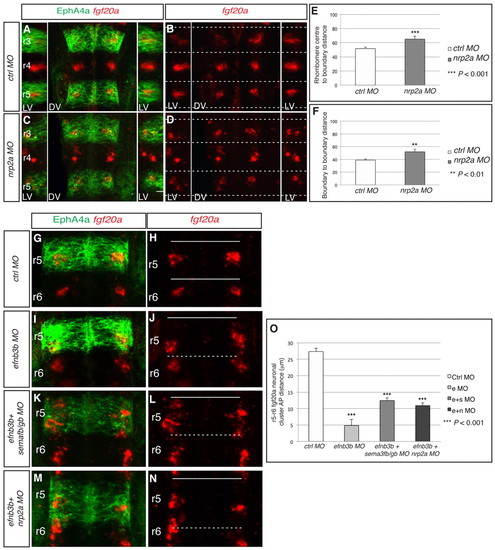
Strategy to measure the distribution of fgf20a neurons following different gene knockdowns. (A) Scheme of the procedure to collect images and measure the average distance from fgf20a neuronal clusters to boundaries compared with the rhombomere centre-to-boundary distance (α), and the average fgf20a neuronal cluster length compared with the boundary-to-boundary length (β). (B-E) Examples of confocal images of fgf20a-expressing cells in 24-hpf zebrafish hindbrain, anterior to the top. All images are fitted to the same area, with its longitudinal side going from one hindbrain boundary at the bottom to another at the top (visualised by Epha4a expression, not shown). (B) Control MO; (C) rfng MO; (D) sema3fb+sema3gb MOs; (E) nrp2a MO. |

