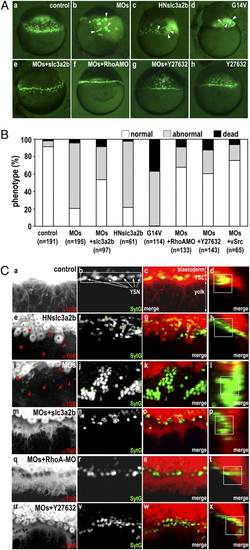
Loss of function of Slc3a2 severely alters YSL organization, which is restored by inhibition of RhoA or ROCK. (A) The YSN are visualized by Sytox green. Shown are lateral views of dome-stage embryos from control (a); slc3a2-MOs (MOs) (b); HN-slc3a2-b (HNslc3a2b) (c); RhoA-G14V (G14V) (d); slc3a2-MOs+slc3a2-b (MOs+slc3a2b) (e); slc3a2-MOs+RhoA-MO (MOs+RhoAMO) (f); slc3a2-MOs + treatment with 50 μM Y-27632 (MOs+Y27632) (g); and control treated with 50 μM Y-27632 (Y27632) (h). Clustered YSN are indicated by white arrowheads. Note rescue of YSL phenotypes by coinjecting slc3a2-b-mRNA and RhoA-MO or by treatment with 50 μM Y-27632. (B) Loss of function of Slc3a2 severely alters YSL organization, which is restored by inhibition of RhoA or ROCK or by overexpression of v-Src. Phenotype in the dome-stage embryo is categorized as normal (white) showing uniform distribution of the YSN without YSL deformation/expansion, abnormal (gray) showing altered YSN localization including uneven distribution of the YSN and YSN clustering with YSL deformation/expansion, or dead (black). Data are from more than three different experiments. Total number of embryos is shown below each bar. (C) Inhibition of RhoA or ROCK restores microtubule networks in the YSL in slc3a2-MOs. (a–d) control; (e–h) HNslc3a2b; (i–l) MOs; (m–p) MOs+slc3a2b; (q–t) MOs + RhoA-MO; (u–x) MOs + Y27632. Microtubule networks were visualized by α-tubulin antibody staining (a, e, i, m, q, and u), and the YSN were visualized by Sytox green (b, f, j, n, r, and v). Shown are merged images of α-tubulin (red) and Sytox green (green) (c, g, k, o, s, and w) and reconstituted section views of the merged images rotated by 90° (d, h, l, p, t, and x). Absence or disruption of microtubule arrays in the YSL is indicated by red arrowheads in e and i, and the clustered YSN are indicated by green asterisks in f and j. Control shows overlap of the YSN and dense YSL microtubule networks (white square in d), which are missing in both HNslc3a2b and MOs (h and l). YSL microtubule networks, YSN distribution, and overlapping of the YSN and YSL microtubules are all restored in MOs+slc3a2b, MOs+RhoA-MO, and MOs+Y27632 (m–p, q–t, and u–x).
|

