
FIGURE
Fig. 4
Fig. 4
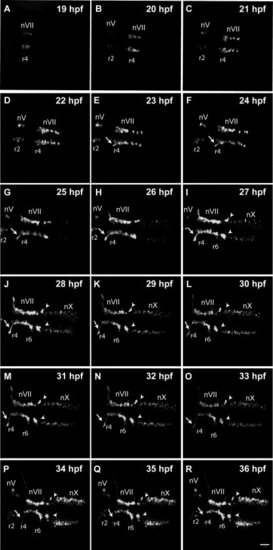
Normal facial motor neuron migration revealed by time-lapse imaging. Panels show frames captured from a time-lapse imaging sequence obtained from a control Tg(isl1:GFP)rw0 embryo. Z-stack projection images are shown from dorsal orientation with anterior to the left. Developmental time is indicated in the upper right-hand corner of each panel. Cranial motor neurons are labeled ?n.? Arrows indicate axons of facial motor neurons (nVII). Arrowheads indicate cluster of nVII neurons in r7. |
Expression Data
| Gene: | |
|---|---|
| Fish: | |
| Anatomical Terms: | |
| Stage Range: | 20-25 somites to Prim-25 |
Expression Detail
Antibody Labeling
Phenotype Data
Phenotype Detail
Acknowledgments
This image is the copyrighted work of the attributed author or publisher, and
ZFIN has permission only to display this image to its users.
Additional permissions should be obtained from the applicable author or publisher of the image.
Full text @ Dev. Dyn.