
Fig. 4
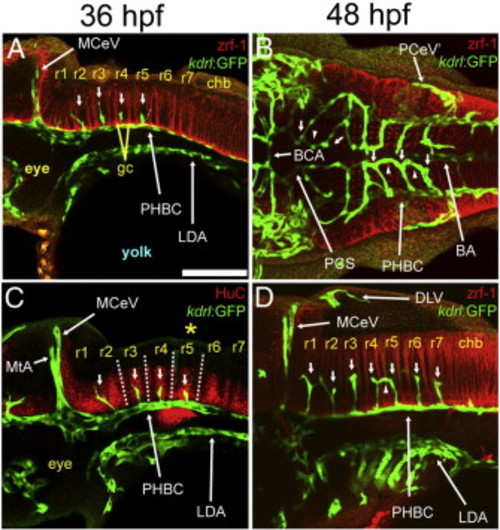
. Relationship between the CtAs and rhombomeres. A-D, Maximum intensity confocal projections of immuno-fluorescently stained embryos carrying the endothelial reporter Tg(kdrl:GFP)1a116. Endothelium, green (GFP). Rhombomere boundaries in A, B, D; red (zrf-1). Differentiated neurons in C; red (HuC). Ages (hpf) indicated above. Abbreviations (see Table 1): vasculature, white (apostrophe, right side); neuroepithelium, yellow. Small white arrows, CtAs. Small white arrowheads, ipsilateral CtA fusions. Yellow asterisk, r5 GFP-positive neuroepithelial signal from the Tg(kdrl:GFP)1a116 reporter. A, C, D, lateral views. Anterior, left. Dorsal, top. B, Dorsal view. Anterior, left. Left side, bottom. Scale bar (A), 100 μm. |
| Gene: | |
|---|---|
| Antibody: | |
| Fish: | |
| Anatomical Terms: | |
| Stage Range: | Prim-25 to Long-pec |
Reprinted from Developmental Biology, 357(1), Ulrich, F., Ma, L.H., Baker, R.G., and Torres-Vazquez, J., Neurovascular development in the embryonic zebrafish hindbrain, 134-51, Copyright (2011) with permission from Elsevier. Full text @ Dev. Biol.