|
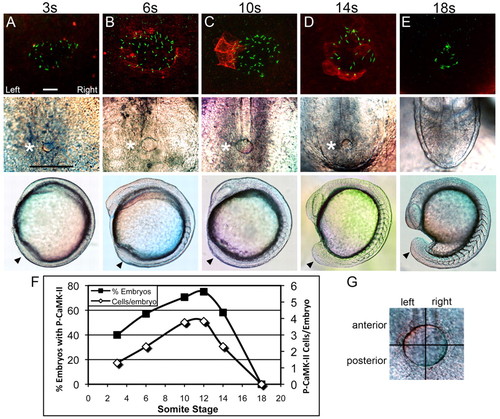
Left-sided CaMK-II activation is transient. (A-E) The top row shows representative confocal immunofluorescent projections of P-T287 CaMK-II (red) and cilia (green) at the three- (A), six- (B), 10- (C), 14- (D) and 18- (E) somite stages. These projections of z-stacks were conducted as in Fig. 1 (12 somites) and are displayed at the same intensity. Scale bar: 10 μm. Middle row shows KV morphology (asterisk) from the same dorsal perspective. Scale bar: 100 μm. Bottom row shows the position of the KV (arrowheads) from the lateral perspective. (F) For each stage (n=14-36 embryos per stage), the percentage of embryos and the number of cells per embryo that exhibited activated CaMK-II was determined by inspecting z-stacks. (G) The location of KV cells exhibiting activated CaMK-II was scored in one of the four quadrants shown here and results can be found in Tables 1 and 2.
|