Fig. S8
- ID
- ZDB-FIG-100603-41
- Publication
- Piloto et al., 2010 - Ovo1 links Wnt signaling with N-cadherin localization during neural crest migration
- Other Figures
- All Figure Page
- Back to All Figure Page
|
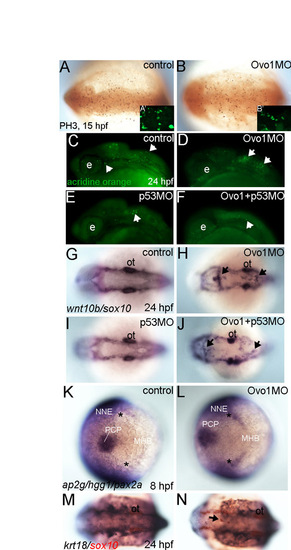
Cell proliferation, apoptosis and ectodermal specification are unaffected in Ovo1 morphants. (A,B) Wholemount anti-phospho-Histone 3 antibody (PH3) staining at 15 hpf. Dorsal views, anterior to the left. (A2,B2) Insets showing PH3+ mitotic cells in cross-sections through the neural tube of control and Ovo1 morphants at 24 hpf. (C-F) Acridine orange labeling (arrows) reveals elevated apoptosis in Ovo1 morphant embryos compared with controls (C,D), which is eliminated by co-injection of p53 MO (E,F). (G-J) Double in situ hybridization for sox10 in NC and wnt10b in dorsal neural tube. In contrast to controls (G), sox10+ cell aggregates form in the dorsal midline of Ovo1 morphants (H), but not in p53 morphants (I), and injection of p53 MO fails to rescue NC defects in Ovo1 morphants (J). (K,L) Triple in situ hybridization for expression of ap2g in non-neural ectoderm (NNE), hgg1 in prechordal plate mesoderm (PCP) and pax2.1 at the midbrain-hindbrain boundary (MHB) in controls (K) and Ovo1 morphants (L) at 8 hpf. Dorsal views, anterior to the left. Asterisks indicate the borders between the NE and NNE. (M,N) Double labeling for sox10 (red) in NC and krt18 expression in epidermis (dark blue) in control (M) and Ovo1 morphants (N). Dorsal clumps of sox10+ NC cells form in morphants, while epidermis appears unaffected (arrows). e, eye; ot, otic vesicles. |

