Fig. 3
- ID
- ZDB-FIG-100322-14
- Publication
- Kimmel et al., 2010 - Modes of developmental outgrowth and shaping of a craniofacial bone in zebrafish
- Other Figures
- All Figure Page
- Back to All Figure Page
|
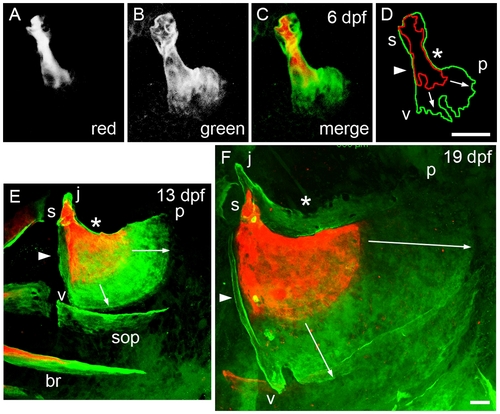
Mineralized matrix addition occurs in a stereotyped spatiotemporal pattern. Live confocal imaging as in Figure 1. The larvae were vitally stained successively with two Ca2+-binding dyes, first Alizarin Red S, then Calcein (green), with a washout period between the two applications. They were imaged just after the second staining period. (A-D) The same Op, stained first for 2 hr at 3 dpf (A, red channel), and then overnight between 5 and 6 dpf (B, green channel). C shows the merge and D the outlines of the two colors. The vj edge (arrowhead in D) and jp edge (asterisk) show only a thin layer of new (green) matrix on top of the older (red) matrix. In contrast, the vp edge, showing short spurs at the time of the first pulse, grows out prominently (arrows in D). (E) Another preparation in which a larva was stained with overnight first at 6–7 dpf and then at 12–13 dpf. The jp edge, as at the earlier stage, shows only a very thin layer of new (green) bone (asterisk). The veil along the vj edge (arrowhead), and the upward pointing short j apex spur are made of new bone. Note that this two-color matrix staining method also reveals that mineralization of the branchiostegal ray (br) began before 7 dpf (since the br is doubly labeled), but that subopercle (sop) mineralization is initiated only after day 7 (since the sop is not Alizarin Red-labeled). (F) A preparation stained overnight first at 12–13 dpf and then at 18–19 dpf. In contrast to the earlier stages, there is now an elaborate outgrowing veil, made of new bone, along dorsal jp edge. The anterior strut along the vj edge is new (arrowhead), and the j apex has elongated by new bone addition. Note that in both E and F the outgrowth of the vp edge is differential, more rapid near the p apex than near the v apex, as indicated by the lengths of the arrows. Abbreviations and orientations as in Figure 1. Scale bars: 40 μm. |

