
Fig. 3
- ID
- ZDB-FIG-100309-31
- Publication
- Gutzman et al., 2010 - Epithelial relaxation mediated by the myosin phosphatase regulator Mypt1 is required for brain ventricle lumen expansion and hindbrain morphogenesis
- Other Figures
- All Figure Page
- Back to All Figure Page
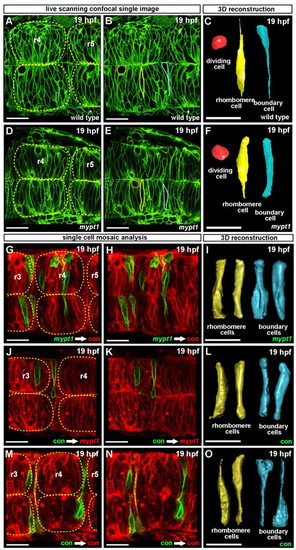
Abnormal cell shape in mypt1 mutants and cell shape mosaic analysis. (A-F) Wild-type and mypt1 mutant zebrafish embryos injected with memGFP mRNA and confocally imaged. Single cells were traced through a z-series then reconstructed in 3D. (A) Wild-type embryo at 19 hpf. (B) Same image as in A but with the three cells outlined shown in one z-plane. (C) 3D shape of the cells shown in B. (D) mypt1 mutant embryo at 19 hpf. (E) Same image as in D but with the three cells outlined shown in one z-plane. (F) 3D shapes of cells shown in E. Rhombomeres are outlined with yellow dashed lines and boundary cells are visible between rhombomeres (A,D). Red, dividing cell; yellow, rhombomere cell; blue, boundary cell. Wild-type and mypt1 mutant dividing cells were similar in shape. Each image is representative of three independent experiments; at least three embryos were imaged and three to five cells were reconstructed in 3D for each embryo, per experiment. (G-O) Wild-type embryos were injected with control MO or mypt1 MO and memCherry or memGFP mRNA as indicated. Cells were transplanted from the memGFP-injected donors to memCherry-injected hosts. Transplanted embryos were imaged at 19 hpf by laser-scanning confocal microscopy. (G,H) Control MO-injected host (red) with mypt1 MO donor cells (green). (I) 3D shape of transplanted donor cells. (J,K) mypt1 MO-injected hosts (red) with control MO donor cells (green). (L) 3D shape of transplanted donor cells. (M,N) Control MO-injected host (red) with control MO donor cells (green). (O) 3D shape of transplanted donor cells. Rhombomeres are outlined in yellow (G,J,M). Each image is representative of at least three independent experiments in which at least three embryos were imaged; three or more cells were reconstructed in 3D for each embryo per experiment. Scale bars: 25 μm. |