
Fig. 5
- ID
- ZDB-FIG-090515-36
- Publication
- Martin et al., 1995 - Five Trk receptors in the zebrafish
- Other Figures
- All Figure Page
- Back to All Figure Page
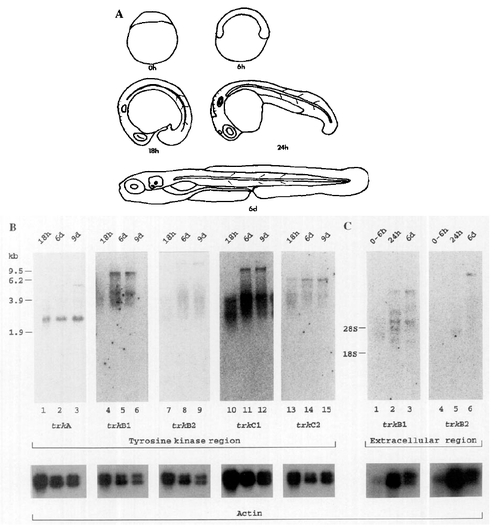
Northern blot analysis of zebrafish trk expression. (A) Diagrammatic outline of zebrafish developmental stages at the indicated stages in hours and days after fertilization, (B and C) Aliquots of 10 μg (B) or 2 μg (C) of poly(A)+ RNA from the time after fertilization is indicated above each lane. Hybridizations were carried out at 68°C in 2x SSC. The identity of the trk probe used is indicated below each panel. Different size markers were used for the blots in B and C. RNA markers for B are in kilobases. The positions of 28S and 18S rRNAs are marked for C. The lower panel is the result of hybridizations of each filter to chicken β-actin. The data were collected with a Fuji BAS 2000 Bioimager, with the exception of the actin signals that were recorded on X-ray film. |
| Genes: | |
|---|---|
| Fish: | |
| Anatomical Term: | |
| Stage Range: | Germ-ring to Days 7-13 |
Reprinted from Developmental Biology, 169, Martin, S.C., Marazzi, G., Sandell, J.H., and Heinrich, G., Five Trk receptors in the zebrafish, 745-758, Copyright (1995) with permission from Elsevier. Full text @ Dev. Biol.