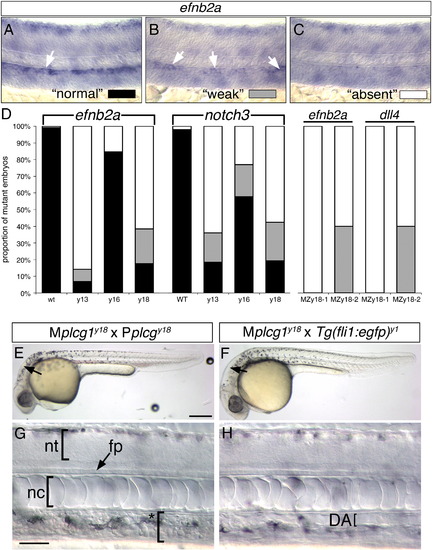
Artery differentiation defects in plcg1 mutants. (A?C) Classification schema to categorize level of artery marker gene expression in plcg1 mutant embryos. Differential interference contrast (DIC) images of zebrafish embryo trunks following whole mount in situ hybridization to detect ephrinb2a (efnb2a). (A) Normal ephrinb2a expression in the dorsal aorta (white arrow). (B) Weak ephrinb2a in distinct patches within the dorsal aorta (white arrows). (C) Loss of dorsal ephrinb2a expression classified as ?absent?. (D) Quantification of artery marker gene expression in y13, y16, y18 and MPZy18 mutant embryos. (E, F) Transmitted light images of embryos at 30 hpf. Scale bar is 250 μM. (G, H) DIC images of embryos at 30 hpf. (E?H) Lateral views, anterior to the left, dorsal is up. (E, G) MPZplcg1y18 mutant embryo. Scale bar is 30 μM; nt ? neural tube, fp ? floor plate, nc ? notochord. Asterisked bracket denoted absence of defined dorsal aorta or posterior cardinal vein. F, H. Mplcg1y18; Tg(fli1a:egfp)y1 mutant embryo; DA ? dorsal aorta, indicated by a bracket.
|
