
FIGURE
Fig. 5
- ID
- ZDB-FIG-090224-50
- Publication
- Dowling et al., 2009 - Loss of myotubularin function results in T-tubule disorganization in zebrafish and human myotubular myopathy
- Other Figures
- All Figure Page
- Back to All Figure Page
Fig. 5
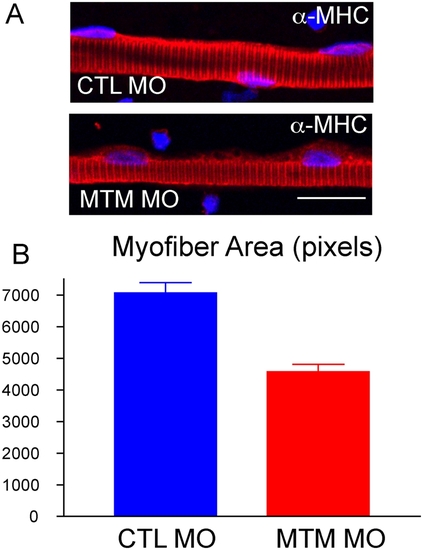
Myofiber hypotrophy in myotubularin morphants. (A) Representative myofibers from control (CTL) and myotubularin (MTM) morphant embryos at 72 hpf. Fibers were immunostained with an antibody to myosin heavy chain (a-MHC). MTM fibers have normal MHC staining, but appear thinner. Scale bar = 20 mm. (B) Quantitation of myofiber size. Control myofibers averaged 7000 pixels, while myotubularin morphant fibers were only 4000 pixels. |
Expression Data
Expression Detail
Antibody Labeling
Phenotype Data
| Fish: | |
|---|---|
| Knockdown Reagent: | |
| Observed In: | |
| Stage: | Protruding-mouth |
Phenotype Detail
Acknowledgments
This image is the copyrighted work of the attributed author or publisher, and
ZFIN has permission only to display this image to its users.
Additional permissions should be obtained from the applicable author or publisher of the image.
Full text @ PLoS Genet.