
FIGURE
Fig. S4
Fig. S4
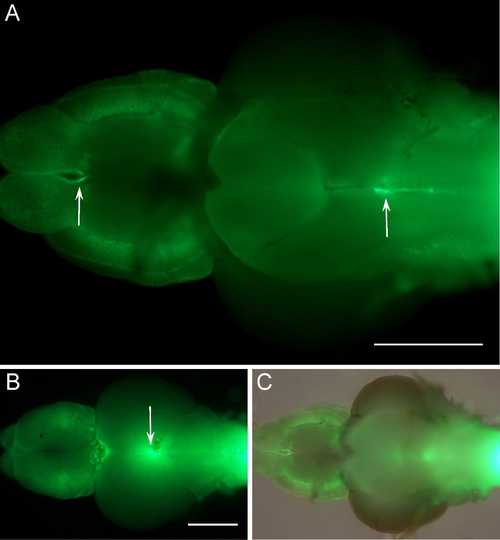
Expression of glial fibrillary acidic protein- green fluorescent protein (GFAP-GFP) on whole-mount brains of adult tg(GFAP-GFP) animals. A-C: Arrows indicate expression in the ventricular zones from the ventral (A,C) and dorsal view (B). C: Merged pictures of the fluorescent signal (B) and a bright field image of the brain. Anterior to the left. Scale bar = 500 μm in A,B. |
Expression Data
Expression Detail
Antibody Labeling
Phenotype Data
Phenotype Detail
Acknowledgments
This image is the copyrighted work of the attributed author or publisher, and
ZFIN has permission only to display this image to its users.
Additional permissions should be obtained from the applicable author or publisher of the image.
Full text @ Dev. Dyn.