
FIGURE
Fig. S3
Fig. S3
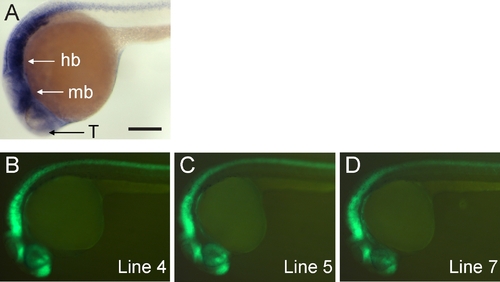
Embryonic expression of zebrafish nestin and tg(-3.9nestin:GFP) transgenic lines. A: Endogenous nestin mRNA expression. B-D: Expression of three stable transgenic lines driven by -3.9 kb of nestin upstream regulatory region. Anterior left, dorsal up. Embryos are 24 hours postfertilization (hpf). Hb, hindbrain; mb, midbrain; T, telencephalon. Scale bar = 250 μm in A. |
Expression Data
Expression Detail
Antibody Labeling
Phenotype Data
Phenotype Detail
Acknowledgments
This image is the copyrighted work of the attributed author or publisher, and
ZFIN has permission only to display this image to its users.
Additional permissions should be obtained from the applicable author or publisher of the image.
Full text @ Dev. Dyn.