
Fig. S3
- ID
- ZDB-FIG-080715-22
- Publication
- Krens et al., 2008 - Distinct functions for ERK1 and ERK2 in cell migration processes during zebrafish gastrulation
- Other Figures
- All Figure Page
- Back to All Figure Page
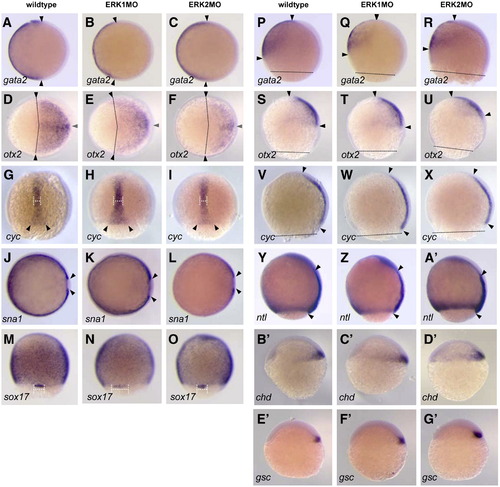
Expression of embryonic patterning marker genes in ERK1 and ERK2 morphants Expression of mRNA was detected by whole mount in situ hybridization. (A?F, J?L); animal pole view, dorsal to right, (G?I,M?O) dorsal view, animal pole to top, (P?G′) lateral view, dorsal to right, animal pole to top. (A?C, P?R) gata2, expressed in non-neural ectoderm, at 80% epiboly. (D?F, SU) otx2, expressed in ectoderm at, 90% epiboly. (G?I, V?X)) cyclops/ndr2 in axial mesoderm at 80?90% epiboly. (J?L) snail1a in paraxial mesoderm at 90% epiboly. (M?O) sox17 in endoderm and forerunner cells at 80% epiboly. (Y?A′) notail in margin an axial mesoderm at 90% epiboly. (B′?D′) chordin in presumptive dorsal shield. (E′?G′) goosecoid in presumptive dorsal shield. Arrowheads mark the different boundaries of the different marker gene expression domains; the dotted line in P?X marks the boundary of epiboly progression. |
| Genes: | |
|---|---|
| Fish: | |
| Knockdown Reagents: | |
| Anatomical Terms: | |
| Stage Range: | Shield to 90%-epiboly |
Reprinted from Developmental Biology, 319(2), Krens, S.F., He, S., Lamers, G.E., Meijer, A.H., Bakkers, J., Schmidt, T., Spaink, H.P., and Snaar-Jagalska, B.E., Distinct functions for ERK1 and ERK2 in cell migration processes during zebrafish gastrulation, 370-383, Copyright (2008) with permission from Elsevier. Full text @ Dev. Biol.