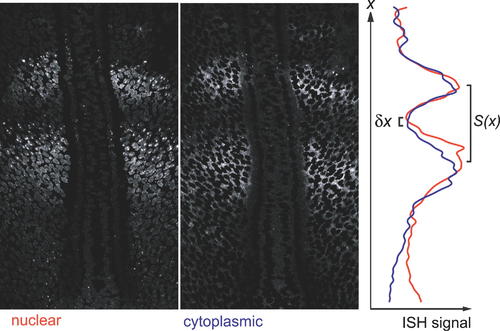
Fig. 4
|
Estimation of Transcriptional Delay from In Situ Hybridisation Pattern. The spatial offset between the anterior margin of the band of nuclear dots and the anterior margin of the band of cytoplasmic signal in specimens stained as in Figure 3 gives a measure of the transcriptional delay. To measure this offset, we used Photoshop to generate from the image of each specimen a pair of pictures, one (left-hand panel) showing only the ISH signal that was nuclear (i.e., co-localized with DNA staining), the other (middle panel) showing only the signal that was cytoplasmic (i.e., co-localized with an absence of DNA staining); note, however, that because of the non-zero thickness of the optical section, the ?nuclear? signal includes a sizeable contribution from cytoplasmic mRNA where the latter is plentiful. For each of these two images, we computed the smoothed mean intensity of staining as a function of distance x along the anteroposterior axis (see Materials and Methods), and plotted the results together on the same graph (right-hand panel). The delay from the beginning of the rise in nuclear signal to the beginning of the rise in cytoplasmic signal corresponds to the spatial offset δx between the minima of the red and blue curves. We converted this offset to a time interval using Equation 3 and the local values of x, L, S(x), and S0 measured from the same specimen. |

