
FIGURE
Fig. 6
Fig. 6
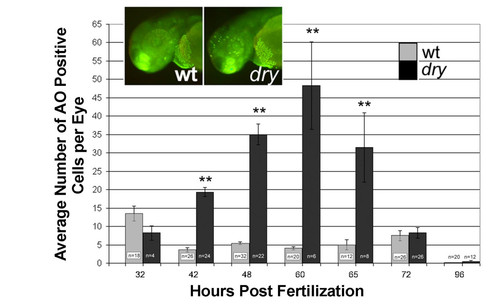
Elevated cell death in disarrayed retinas. Acridine orange (AO) was used to label dying cells in the living zebrafish embryo. The average number of positive cells per retina in wild-type (grey bars) and disarrayed embryos (black bars) is presented. Inset shows chromatin fluorescence (green) in wild-type (left) and disarrayed (right) embryos following acridine orange treatment at 48 hpf. Note that there are significantly more cells labeled in the disarrayed mutant retina and forebrain when compared to wild-type. ** p ≤ 0.01 (Student's t-test). n = total number of embryos counted. |
Expression Data
Expression Detail
Antibody Labeling
Phenotype Data
| Fish: | |
|---|---|
| Observed In: | |
| Stage Range: | High-pec to Protruding-mouth |
Phenotype Detail
Acknowledgments
This image is the copyrighted work of the attributed author or publisher, and
ZFIN has permission only to display this image to its users.
Additional permissions should be obtained from the applicable author or publisher of the image.
Full text @ BMC Dev. Biol.