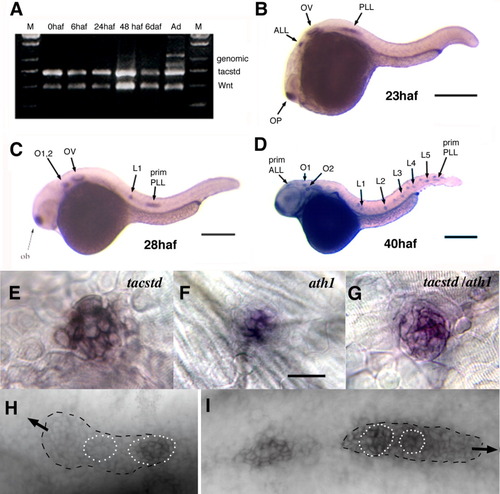
Developmental expression of tacstd. A: RT-PCR detection of tacstd message at 0, 6, 24, 48 haf, 6 daf, and adult (Ad) stages. Amplification of Wnt5a message is used as a positive control. The adult mRNA sample was contaminated with genomic DNA as amplification of genomic sequence produces a larger product (labelled as "genomic"). B-D: Whole mount in situ hybridization using a tacstd riboprobe. Embryos were processed for hybridization at 23 (B), 28 (C), and 48 haf (D). E-G: Neuromasts of in situ hybridized embryos. Probes used were tacstd (E), ath1 (F), or both probes (G). H,I: tacstd expression in the anterior lateral line (H) or posterior lateral line (I) primordia. Arrows indicate direction of migration. Dotted circles demarcate cells showing a rosette pattern, which is coincident with strong expression of tacstd. Expression to the left of the primordium in I is a recently deposited proneuromast. ALL, anterior lateral line; L1-5, posterior lateral line neuromasts; O1,2, otic neuromasts; OP, olfactory placode; OV, otic vesicle; PLL, posterior lateral line; prim, primordium.
|

