
Fig. S7
- ID
- ZDB-FIG-190819-12
- Publication
- Veloso et al., 2019 - Dephosphorylation of HDAC4 by PP2A-Bδ unravels a new role for the HDAC4/MEF2 axis in myoblast fusion
- Other Figures
- All Figure Page
- Back to All Figure Page
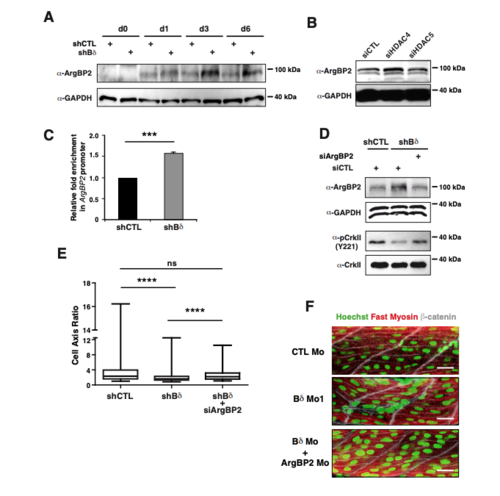
PP2A-Bδ controls expression of ArgBP2 via HDAC4. (A) Western blot analysis of ArgBP2 levels in C2C12 myoblasts transfected with a control (siCTL), anti-HDAC4 (siHDAC4) or anti-HDAC5 (siHDAC5) siRNA. GAPDH (αGAPDH) was used as loading control. (B) ChIP analysis of MEF2 binding to the ArgBP2 promoter in control (shCTL) and BδKD (shBδ) C2C12 myoblasts at day 3. Immunoprecipitations were realized with a control IgG or an anti-MEF2 antibody. Results are expressed as mean percent of input ± SD, relative to the control IgG and standardized to shCTL cells, from 3 independent experiments, unpaired two-tailed t-test, *** P<0.001. (C) Western blot analysis of ArgBP2 (α-ArgBP2) in control (shCTL) and Bδ-knocked down (shBδ) C2C12 myoblasts at the indicated time points during the differentiation process. GAPDH (α-GAPDH) was used as loading control. Images are representative of 2 independent experiments. (D) Analysis of ArgBP2 (α-ArgBP2) and activity of CrkII as assessed by phosphorylation of its inhibitory Y221 (α-pCrkII (Y221)) in control (shCTL) and Bδ-knocked down (shBδ) C2C12 myoblasts transfected with a control siRNA or a siRNA against ArgBP2 (siArgBP2). GAPDH (α-GAPDH) and total CrkII (α-CrkII) were used as loading control. (E) Major/minor cell axis ratio in control (shCTL) and Bδ-knocked down (shBδ) C2C12 myoblasts grown in GM and transfected with a control siRNA or an siRNA against ArgBP2 (siArgBP2). Results were calculated on >200 cells/experiment from 2 independent experiments, unpaired two-tailed t-test, **** P<0.0001. (F) Representative confocal pictures of fast skeletal myosin (red) and β-catenin (white) in control (CTL Mo, n=6 independent experiments) or PP2A-Bδ (Bδ Mo, n=6 independent experiments) morphant embryos, injected with morpholino against ArgBP2 (ArgBP2 Mo, n=10 independent experiments). Nuclei of fast skeletal fibers were stained with Hoechst (green). Scale bars are 100µm |