
- Title
-
A monoallelic variant in CCN2 causes an autosomal dominant spondyloepimetaphyseal dysplasia with low bone mass
- Authors
- Li, S., Shao, R., Li, S., Zhao, J., Deng, Q., Li, P., Wei, Z., Xu, S., Chen, L., Li, B., Zou, W., Zhang, Z.
- Source
- Full text @ Bone Res
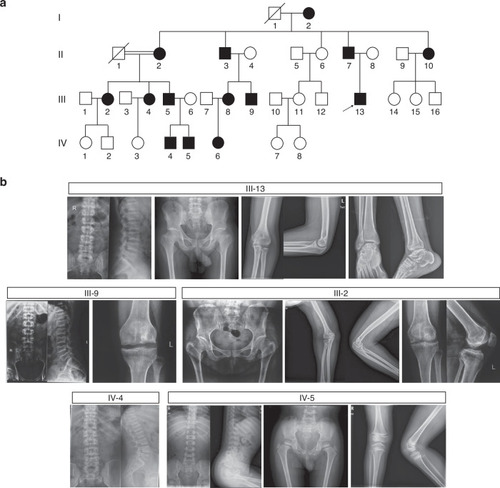
Pedigree and radiographical features of a large Chinese family with spondyloepimetaphyseal dysplasia (SEMD). |
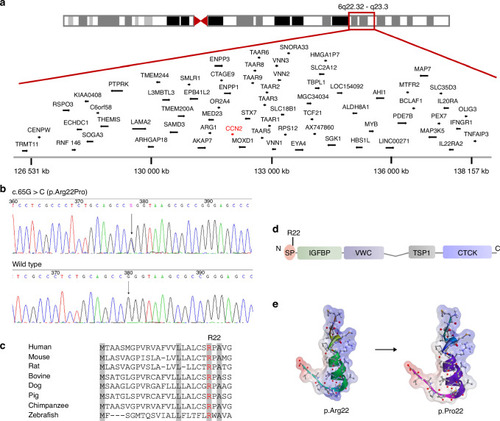
Identification of a pathogenic variant in |

|
|

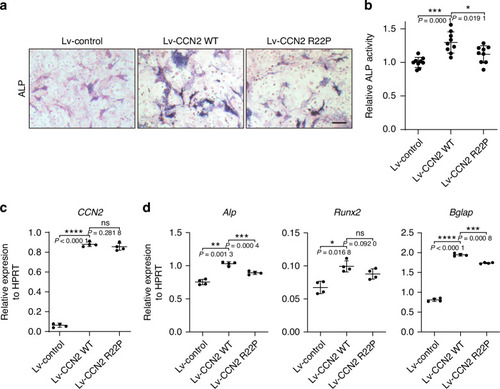
Overexpression of |
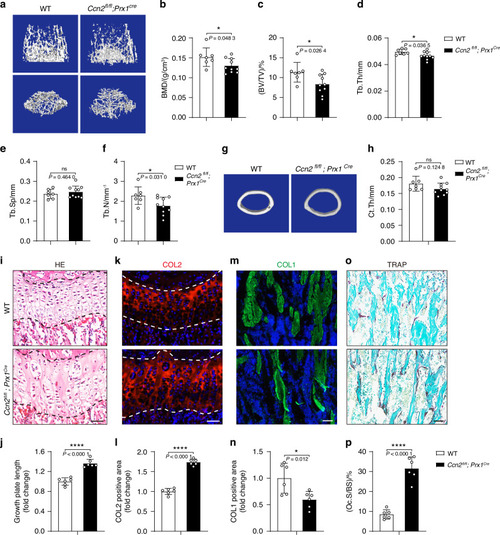
Deletion of |