
- Title
-
Exploring Estrogen antagonism using CRISPR/Cas9 to generate specific mutants for each of the receptors
- Authors
- Guerrero-Limón, G., Muller, M.
- Source
- Full text @ Chemosphere
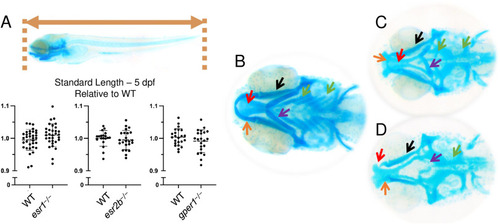
Phenotypes found in esr1 mutants. A) Lateral view of a WT sibling, illustrating the measure of the standard length (orange arrow) and graphs representing the measures of standard lengths (relative to the mean of the WT larvae) of each mutant compared to their WT siblings; B) Dorsal view of the stained head cartilage of a 5 dpf WT larva; C) Observed chondrocranium malformations in esr1 mutant fish: total absence of ceratobranchial 1–5 (green arrows), reduced Meckel's cartilage (orange arrow), thinner palatoquadrate (black arrow) and deformed ceratohyals (violet arrow; D) another example of observed malformations in 5 dpf zebrafish larvae: heavily reduced or total absence of Meckel's cartilage (orange arrow), deformed ethmoid plate (red arrow), thinner palatoquadrate (black arrow), heavily deformed ceratohyal (violet arrow) and absence of ceratobranchials 1–5 (green arrow). (For interpretation of the references to colour in this figure legend, the reader is referred to the Web version of this article.) |

Morphometrics of esr1⎯/⎯, esr2b⎯/⎯, and gper1⎯/⎯ mutants compared to WT. Illustrations above each plot, or on the left for figure E, are a representation of how the different measurements were performed. A) Length of ceratohyals (LC); B) Distance between the frontal end of the ceratohyals and the line connecting the posterior ends of the hyosymplectics (DCH); C) Distance between the left and right Meckel's cartilage/Palatoquadrates (MPQ); D) Distance covering the entire Meckel's cartilage, palatoquadrate, and the hyosymplectics (MPH); E) Angle between ceratohyals (ACT). An Unpaired Mann-Whitney t-test was performed on 24 fish per group (either Mutants or WT) per assessed parameter. Asterisks (*) indicate when significant differences were found for a mutant strain compared to its WT siblings, p < 0.05 (*), p < 0.01 (**). All values were normalized relative to the mean value of the corresponding WT siblings for each mutant strain. PHENOTYPE:
|
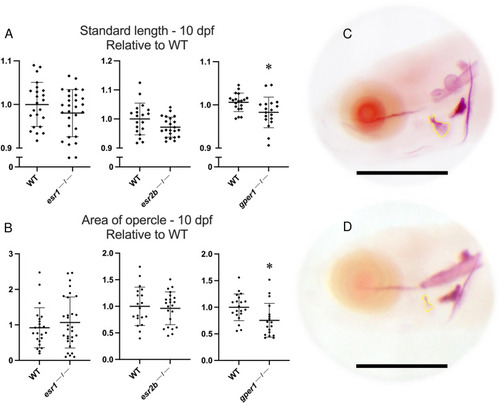
A) Standard length of mutant larvae at 10 dpf relative to their WT siblings; B) opercle area measured for all mutant larvae relative to their WT siblings; C) Example of alizarin red stained WT larva and D) a gper1⎯/⎯ mutant, the opercle area measured using FIJI is outlined in green, the size bar represents 500 μm. Unpaired Mann-Whitney t-test. Asterisks (*) indicate when significant differences were found for each mutant strain compared to its WT siblings, p < 0.05 (*). All values were normalized relative to the mean value of the corresponding WT siblings for each mutant strain. (For interpretation of the references to colour in this figure legend, the reader is referred to the Web version of this article.) PHENOTYPE:
|
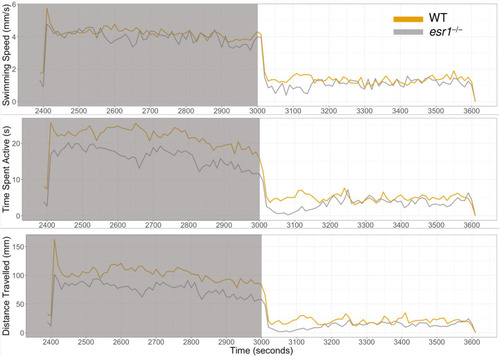
Actograms of the recorded parameters in 5 dpf zebrafish larvae of WT and esr1⎯/⎯ fish. The graphs represent the mean Swimming Speed when active, Time Spent Active, or Distance Travelled of 72 individuals observed in10 s intervals during 20 min, with a switch from dark to light that occurred at Time 3000 s. PHENOTYPE:
|
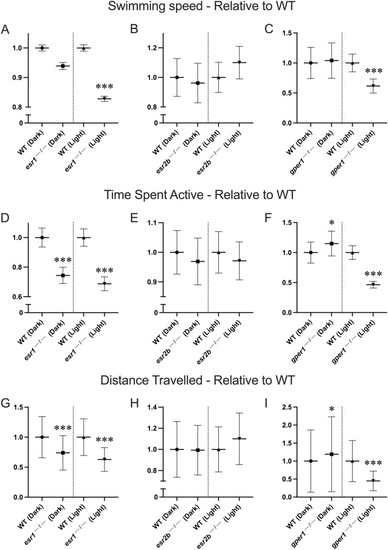
Relative mean values of the three assessed parameters in each mutant strain during the motility test: Swimming speed (A–C), Time Spent Active (D–F) and Distance travelled (G–I). Asterisks (*) indicate when significant differences were found compared to WT of each mutant strain, p < 0.05 (*), <0.001 (***). All values were normalized relative to the mean value of the corresponding WT for each mutant strain. PHENOTYPE:
|
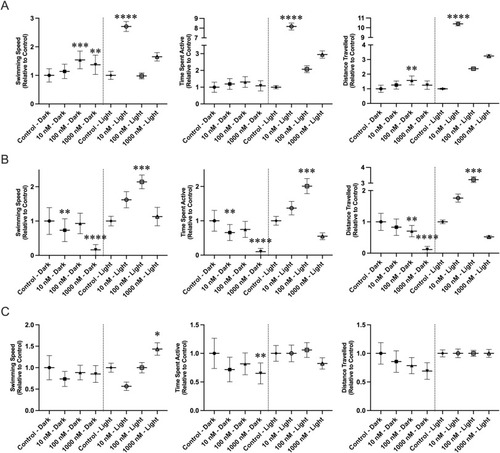
Zebrafish larvae behavioral parameters recorded following 96 hpf chronic exposure to (by row) A) MPP (ER⍺ antagonist); B) PHTPP (antagonist of ERβ) C) G15 (antagonist of GPER1). Asterisks (*) indicate when significant differences were found compared to control, p < 0.05 (*), <0.01(**), <0.001 (***), <0.0001 (****). All values were normalized relative to their respective control group. PHENOTYPE:
|
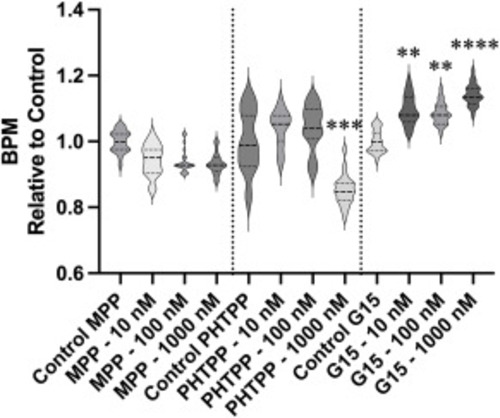
Heart rate of zebrafish larvae measured at 4 dpf. Asterisks (*) indicate when significant differences were found compared to control, p < 0.01(**), <0.001 (***), <0.0001 (****). All values were normalized relative to control of each treatment. PHENOTYPE:
|